An introduction to viewing flood monitoring station data in QGIS
I’m Michael, the newest member to join the Epimorphics team. I work in the front-end team to develop engaging User Interfaces around our linked data platforms. In this role I often work with geographic data from our APIs. To aid in exploration of this data we’ve created a tool to allows our APIs to be easily and quickly loaded in to Geographic Information System (GIS) tools for viewing. This can speed up understanding of a dataset and development of an application.
QGIS
QGIS is a free open-source tool for working with GIS data, allowing you to visualise and edit a a variety of GIS data formats. It’s a great example from the breadth of tools that can work with open datasets. It can load data in from many different geospatial databases as well as from csv files. QGIS is widely used in the governmental and charity sectors. Traditionally to load data from an API you’d download the data as a file, perhaps as a csv, and open it in QGIS. Easily loading arbitrary data directly from an API can be tricky.
JSON to GeoJSON
Many of the APIs we publish are available in the industry-standard JSON format. JSON is a very lightweight data interchange format that’s available in most programming languages and environments. We’ve heard examples from users that they’d like to know how to use this data in GIS applications like QGIS.
GeoJSON is an extension to the JSON standard to encode geographical data and has great support in GIS and web mapping tools.
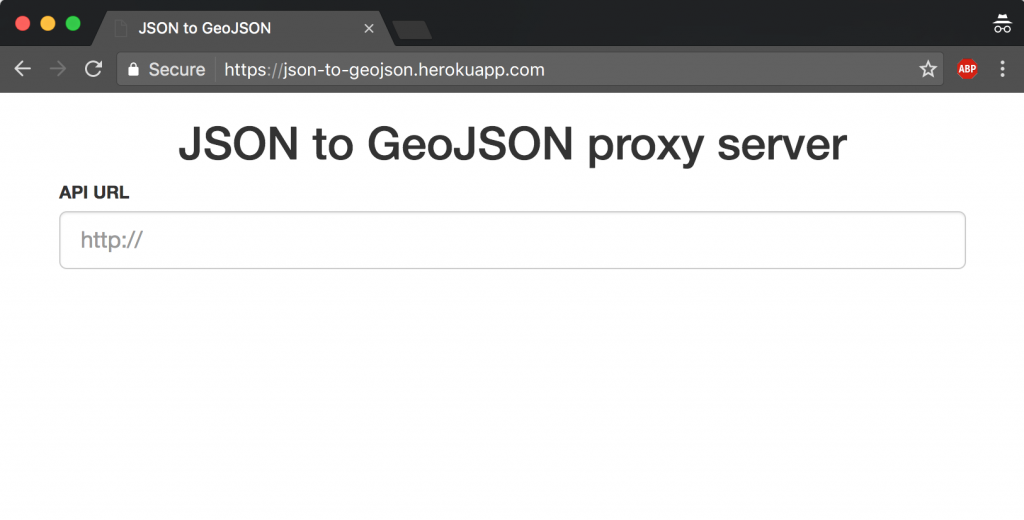
The tool we’ve created is a proxy server that’ll try to convert a JSON endpoint in to a GeoJSON representation. It does this by pulling out the lat and long properties of objects and creating GeoJSON points with them.
One advantage of this approach is that by using an API, instead of downloading as a file, the data is kept in-sync. Each request will load the latest copy of the data. It’s also easier and faster to explore the range of data available.
A copy of the server is available online at: https://json-to-geojson.herokuapp.com.
Why not give it a try with one of these APIs:
Please note this was created as a exploration tool and as such isn’t suitable to be used in production environments
Loading data in QGIS
To load the transformed data in to QGIS treat it as a GeoJSON layer.
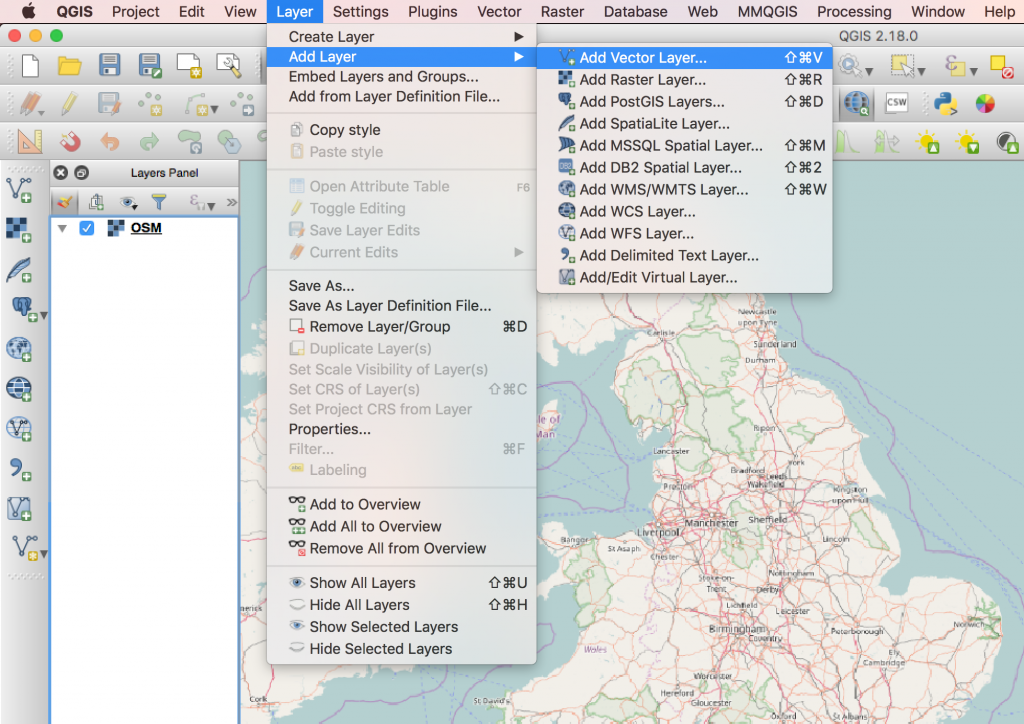
1 – Add a new Vector layer
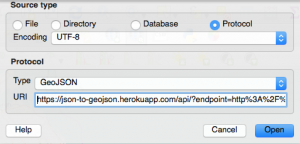
2 – Set the source to protocol, the type to GeoJSON and add the special GeoJSON API link json-to-geojson.herokuapp.com
3 – And you’re done!
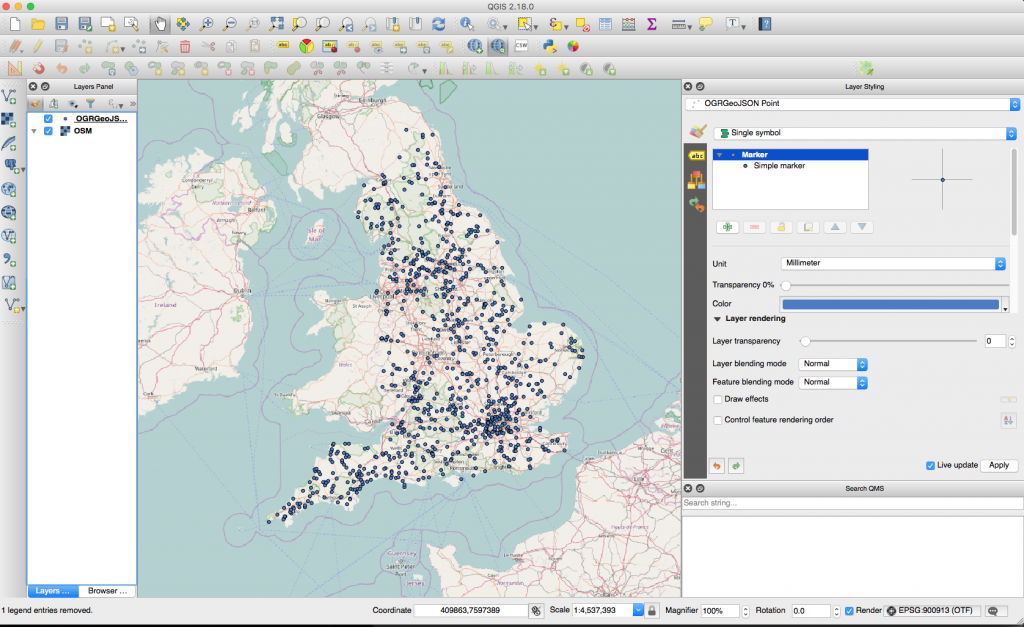
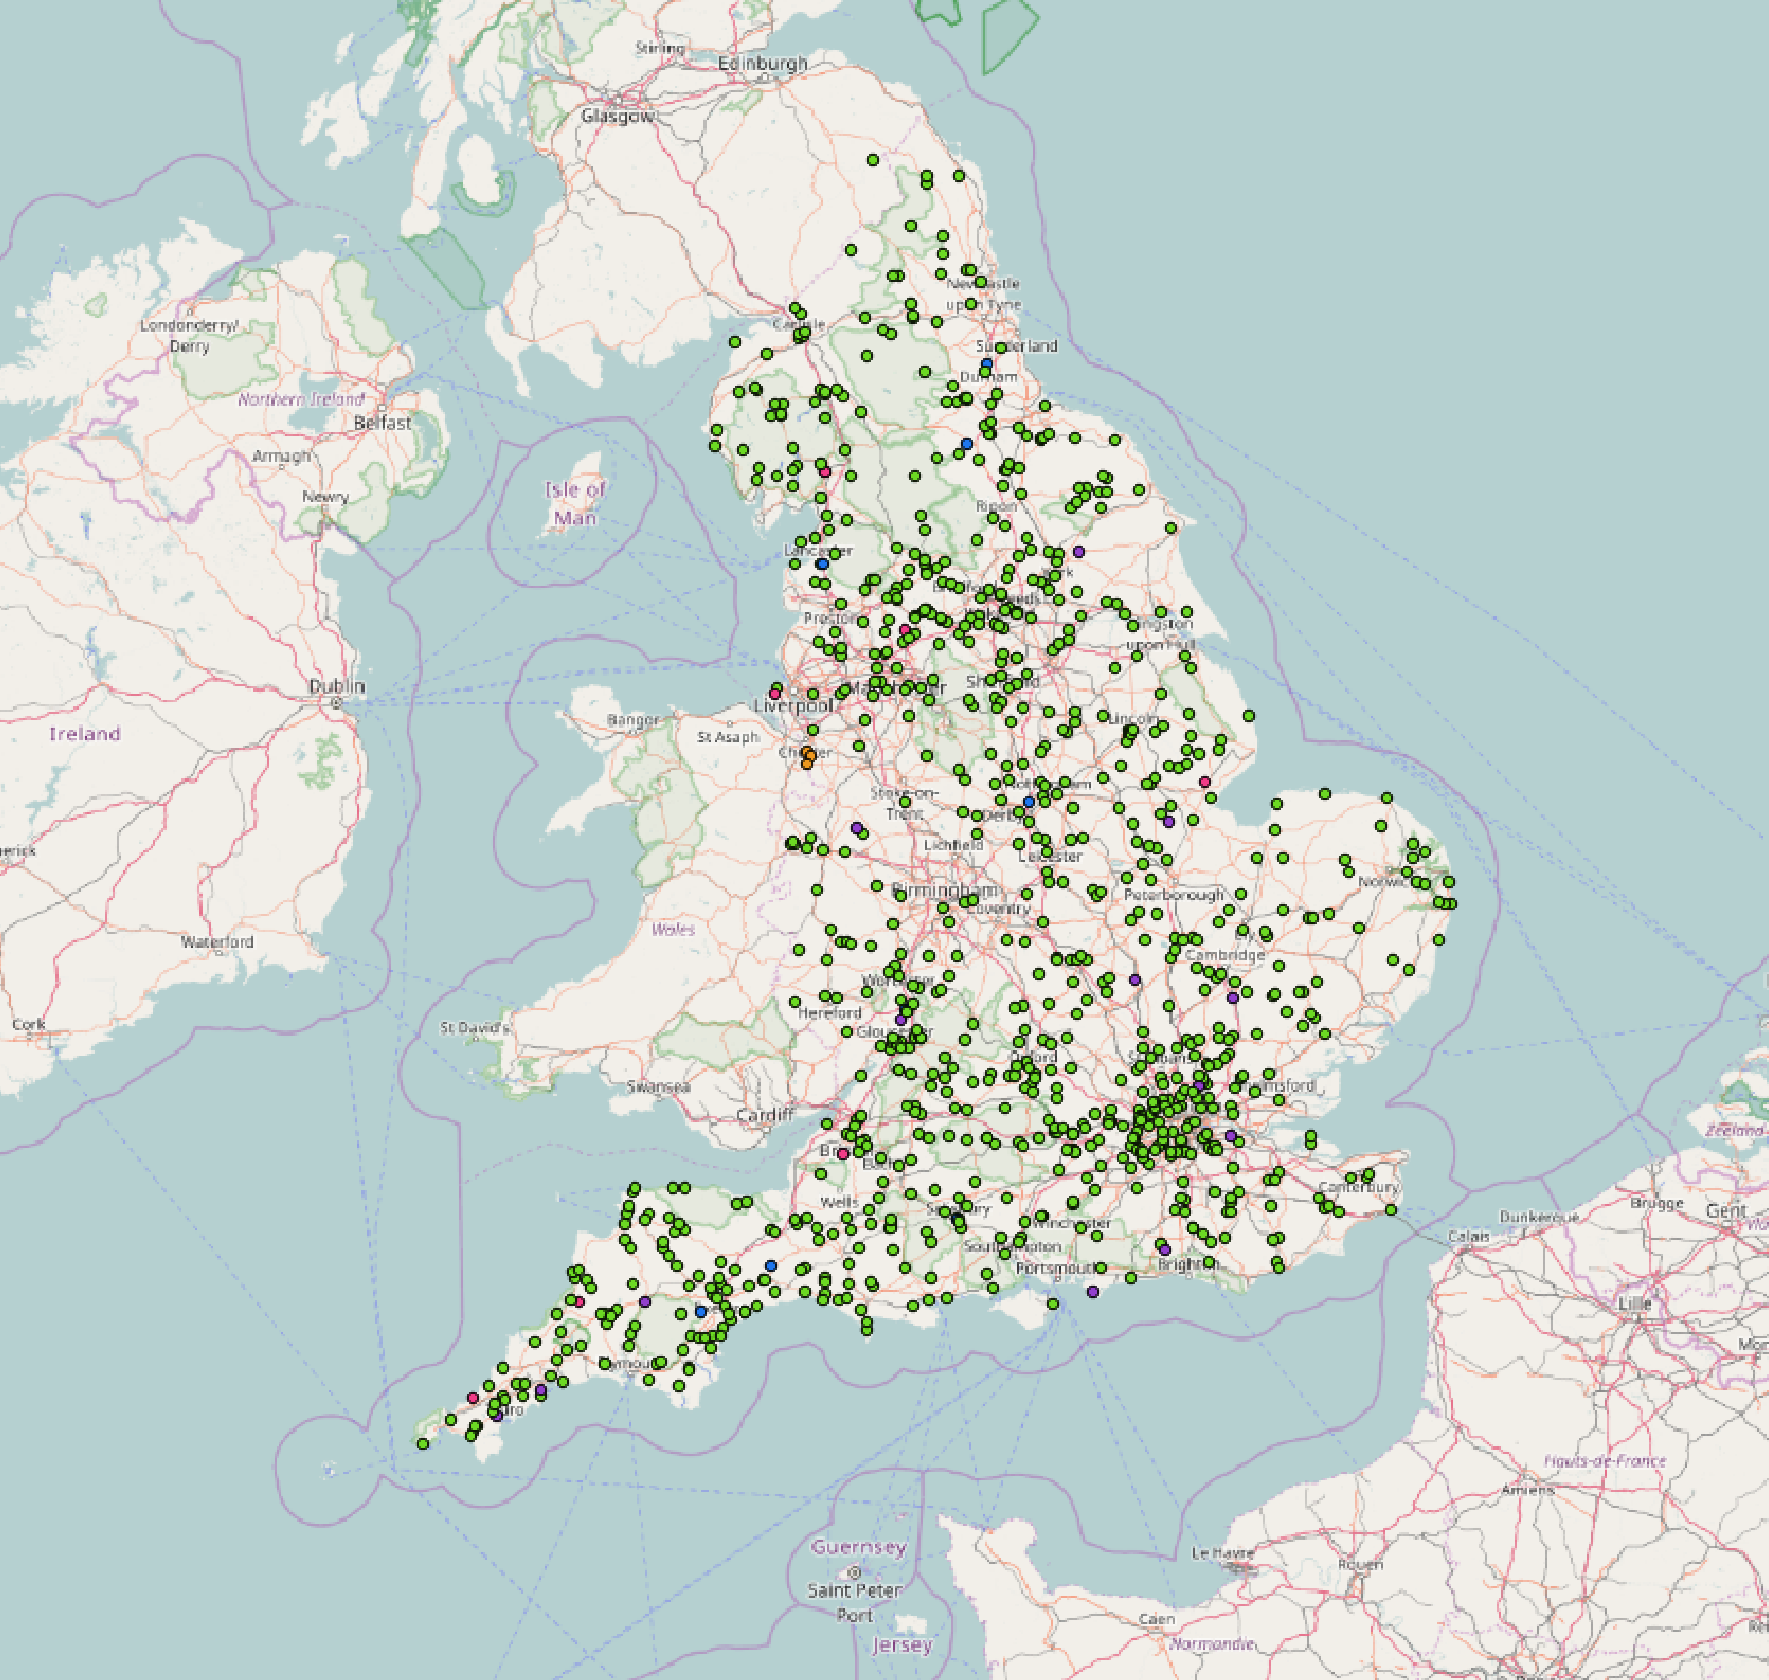
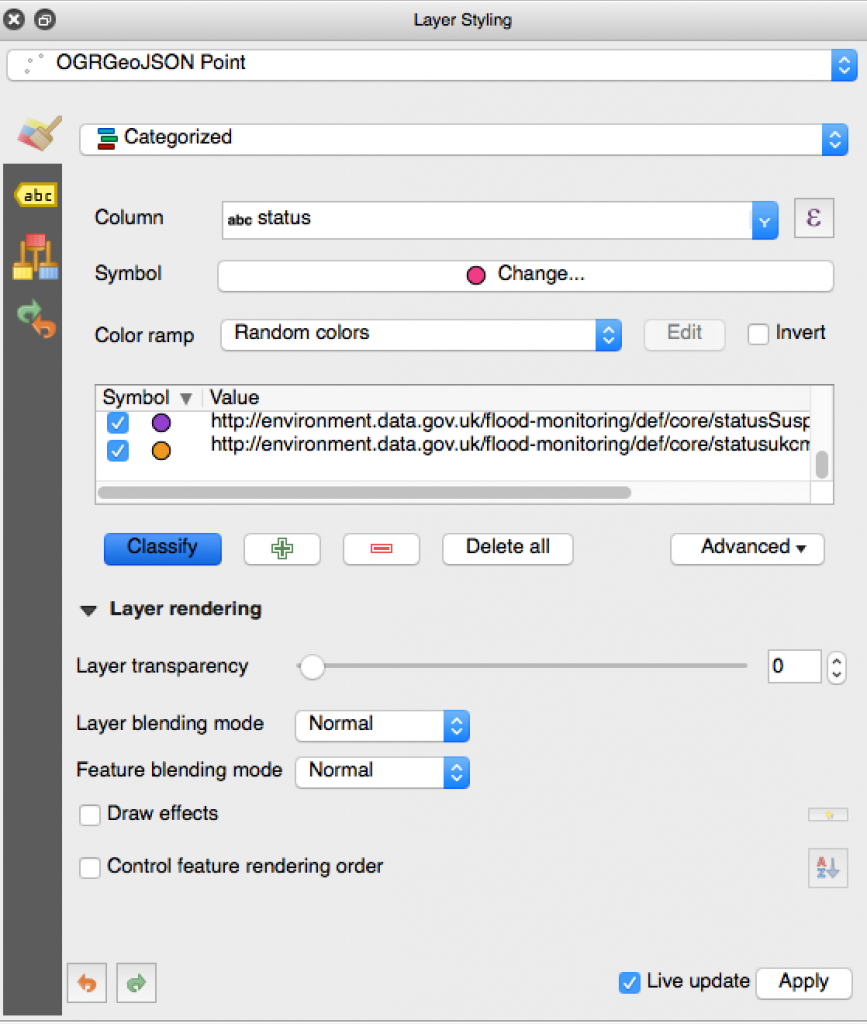
From here it’s possible to style the data using the layer style dialog and to categorise the data using any of the values from the original API call.
How to run a server yourself
The server runs in the Node.js environment, something that can be run on Windows, Mac and Linux easily. It’s also just one click to run this on the Heroku cloud platform to share with others.
The source code for the tool is published under our GitHub team as geojson-proxy.
locally
With the Node.js tools installed on your machine run:
npm install
and
npm start
Heroku
The code can be run on a free Heroku server using the following link.
#TechTalk