2021/22 is the second year we have formally estimated our carbon footprint working closely with carbon footprinting consultants Carbon Footprint Ltd to ensure that we are following standards and guidelines as closely as we can.
Having done our footprint last year, it was easier and quicker pulling the information and data required together this year. That’s not least because Beth, our (new since last year) Finance Administrator has helped streamline the data collection processes for estimating our supply chain footprint.
Learning from our experiences last year, we also extended the supply chain categories that we included this year and did some background research to find a more up-to-date and, hopefully reliable, data source for to help estimate our Scope 3 supply chain (products and services purchased) footprint more accurately.
Scope 1 & 2
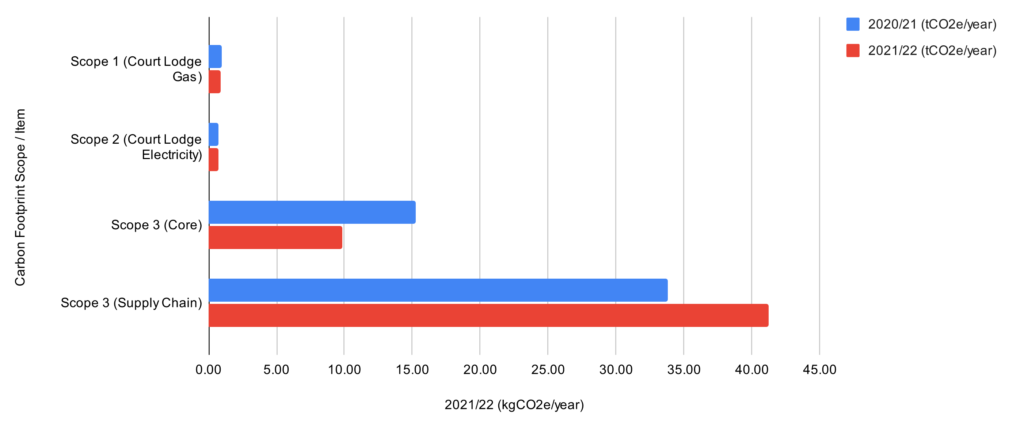
Our Scope 1 from burning gas for heating and hot water at our Court Lodge offices, and Scope 2 emissions, from use of electricity in Court Lodge were
- Scope 1 (Gas) – 0.9 tCO2e/year
- Scope 2 (Electricity) – 0.7 tCO2e/year (location-based) & 0 tCO2e/year (market-based)
- Scope 2 emissions can be reported in two ways:
- Location-based – which assuming the each kWh of electricity we consumed had the overall average carbon intensity kgCO2e/kWh for the UK reporting year.
- Market-based – that takes into account use and contracts for electricity supply that have a lower (or higher) carbon intensity than the UK average. In our case, our supplier is Good Energy, who supply 100% renewable electricity to the UK Grid that is the equivalent used by their customers. That is, they say they match 100% of the electricity sold to customers over a year with power from over renewable generators [1]. That is not the case with many ‘‘renewable’ electricity providers [2].
Slight Aside – reported emissions for year 2022 for corporate reporting in the UK use the emissions factor for 2020 and emissions factors improvement for grid electricity has slowed since the low in 2020
You might have noticed that we said ‘UK reporting year’ above, rather than simply ‘year’. That is because, in looking at the nitty-gritty of the underlying data used for corporate reporting we found that in the UK (and elsewhere) the grid carbon intensities used for reporting are not the actual intensities of emissions that year they are emitted in. They are actually for ‘reporting_year’ – 2 years.
That is, the emissions factor that is applied to electricity use in the reporting year 2022 is actually for generation and emissions made in 2020. This is stated clearly in the Company Reporting Methodology Paper that goes with the emission factors [Reference 12 page 27 para 3.13]
“Table 6 also provides a comparison of how the data year reads across to the GHG conversion factors update/reporting year to which the data and conversion factors are applied, which is two years ahead of the data year. For example, the most recent emission factor for the 2022 GHG Conversion factors is based on the data year 2020”.
Which means that the quantity of ‘reported emissions’ (kgCO2e) are not actually the same as those emitted in that year due to the use of electricity. For example the reporting factor for 2022 is based on data from 2020 [Reference 12 Table 8 page 32].
In part that will be because the reporting factors need to be available during the year in which the reporting is being done, but we do not currently understand why the two year delay, when, in the UK, the national grid report intensities in real-time [13]
Also interestingly the rapid downward trend in emissions factors for UK electricity has stalled somewhat over the last 3 years. Average values for both 2021 and 2022 being higher than 2020 [14], rather than the previous roughly 10% decrease year on year.
That means that the reporting emissions factor for 2022 may be lower than the actual emissions factor for 2022 [14], rather than has been the case for the last 10 years, where it has been higher.The consequence will be for at least the next two years, the historical trend of reductions in reported Scope 2 emissions simply due to UK Grid emissions reductions will not occur and Location-based reductions will require actual electricity use reductions.
Getting back to this year’s reporting … we choose Good Energy and pay for a renewable tariff specifically because they provide 100% renewable energy and also support further investment in renewable generation. However, we also acknowledge that, in practice, our use of electricity increases the carbon intensity of the UK’s electricity supply [3] and so in our summary carbon accounts we choose to use the Location-based rather than Market-based footprint.
In addition, Good Energy states that 10% of their gas supplied is ‘renewable’ and offset the emissions of the remaining 90% using “ independently verified schemes in India, China and Turkey” [4]. Which would again reduce our Scope 1 emissions to zero. For similar reasons to those for electricity, we choose to use the standard UK gas grid intensities.
Both our Scope 1 and Scope 2 emissions reduced slightly from 2020/21. In the case of Gas that is due to a slightly lower use of Gas, most likely due to less cold weather and in the case of electricity we used almost exactly the same amount of electricity but the UK Grid average carbon intensity (kgCO2/kWh), used for corporate reporting, dropped by about 10% from 2020/21.
For a sense of scale in 2022 the medium UK household uses emissions from gas and electricity emissions were approx. 2.8 tCO2e/year [4], so our corporate Scope 1 and 2 emissions are lower than those of a medium household.
However, as you might be thinking – prior to the Covid Pandemic 2018/2019 and the shift to much more home working, Epimorphics Scope 1 and 2 footprint was significantly higher, more like 4.2 tCO2e/year. That’s because we used both more heating and used more electrical equipment in the Court Lodge office as most people (of the 14 of us then) worked in the office four days a week or so, whereas in 2021/22 most people worked at home, most of the time.
Which means that the reduction in Scope 1 and 2 emissions since 2019/20 needs comparing with the very much increased footprint for home working, which is the majority of our Core Scope 3 footprint, combined with changes in commuting, to help really understand the net effects and dynamics of office and home working overall. Which would be a good topic for a future blog item.
Scope 3
Our Core Scope 3 (home working, business travel, employee commuting, secondary emissions from use of gas and electricity) and Supply Chain Scope 3 (Goods and Services purchased), were:
- Core Scope 3 – approx. 9.9 tCO2e/year
- Supply Chain Scope 3 – approx. 41.2 tCO2e/year
Core Scope 3
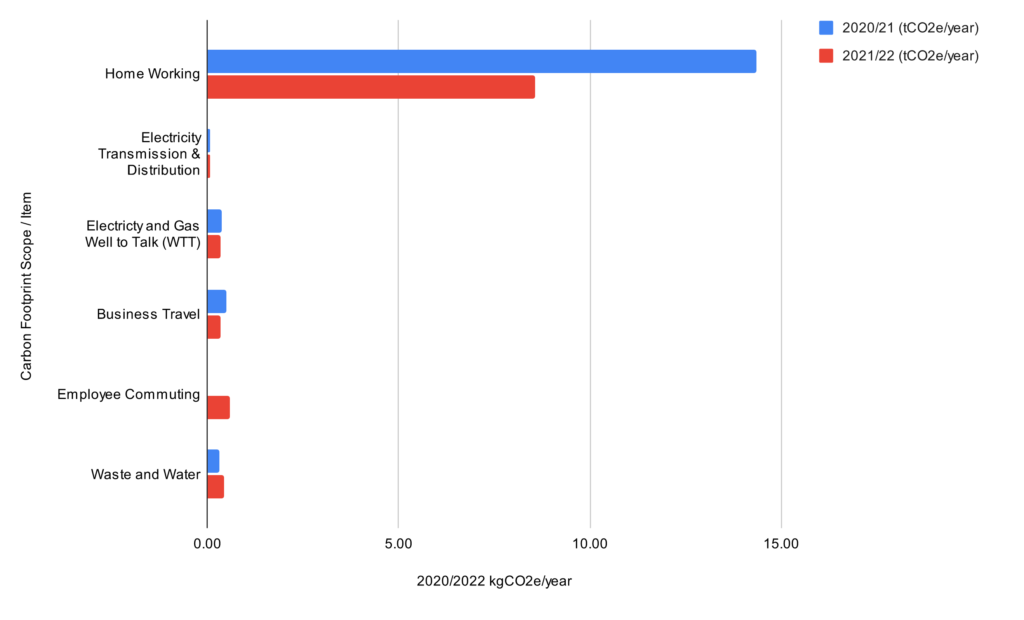
Of our Core Scope 3 footprint, about 87% is from home working of that, about 91% is due to heating of homes, the rest due to use of computer and other office equipment, lighting and making hot drinks.
Home working being a significant component of our Core Scope 3 footprint we conduct an employee survey to model and estimate use of energy for heating (including heating type), use of computer and other office equipment (such as printers, desk lights and fans, etc.) and room lighting.
We then use the methodology developed by the EcoAct Environmental Consultancy [6] to estimate the footprint. Essentially summing up the estimated share in the use of energy, electricity/gas/oil for heating and electricity for other equipment, that is allocated, using the EcoAct methodology to Epimorphics. That allocation is mostly based on the number of working hours.
One nuance in the EcoAct methodology (and other home working assessment methodologies) is that heating is included in the assessment only if that heating would not have been on in any case. That is, if someone else would not have been in the home in any case. Our home-working emissions reduced this year to about 8.5 tCO2e/year in 2021/22 from about 14.3 tCO2e/year in 2020/21, a reduction of about 40%, largely because of changes in staff and in people’s home contexts, those changes led to a higher proportion of homes that would have been heated in any case.
Clearly the reduction in home-working emissions is, at least in part, a feature of accounting and methodology that do not reflect an actual reduction in the real-world, but only which emissions allocated to Epimorphics. Similar accounting quirks are found in many places in carbon accounting. For example, as we have already seen above, with the Scope 2 location-based Vs market-based emissions, where changes in allocated shares of emissions are not directly related to real-world changes in emissions, only the way the total emissions are shared out. There are similar effects in other Scope 3 categories.
It is interesting to note that for the first time this year (2022) the UK government corporate reporting intensities [7] includes home-working intensities (kgCO2e/full-time-equivalent) for Office Equipment and Heating. That works by multiplying the given factors by the number of full time equivalent staff. Their methodology is based on a simplification of the EcoAct methodology (i.e. uses higher level averages). For comparison we used the UK Government guidance methodology. That gave a result of 8.8 tCO2e/year. Where our Staff Staff Survey based result, following the fuller EcoAct approach was 8.5 tCO2e/year and similar order of magnitude.
As can be seen from Figure 2 the changes in Business Travel and Commuting categories of our Core Scope 3 footprint reflect changes since the main Covid lockdowns to slightly more business travel and commuting since 2020/21. However, these are still very much lower than pre-Covid when business travel was about 0.4 tCO2e/year and Commuting 8.8 tCO2e/year.
Supply Chain Scope 3
Our Supply Chain Scope 3 footprint has grown year-on-year by about +22%. This category includes physical goods (computers, desks, etc.) and services (e.g. water, waste, telecoms, digital tools and services, etc.). The reasons for the net increase are more complex – because this category covers all our spending on goods and services. There were variations in different kinds of sub-category in both directions (up and down) leading to the net Year on Year change.
It is worth pointing out that these assessments are simply based on our financial spending, i.e. £s we spent on various types of goods and services. That’s because, as yet, there are not reliable Product or Service Carbon Footprints for most things. Even where there are footprint estimates, it is often not clear what methodology was followed and whether the footprint is accurate and meets the appropriate standards.
That being the case, nearly all corporate reporting and the UK Government Guidance such as the SECR (Streamlined Energy and Carbon Reporting) guidance [8], uses a spend based approach called an Environmentally Extended Input Output (EEIO) methodology.
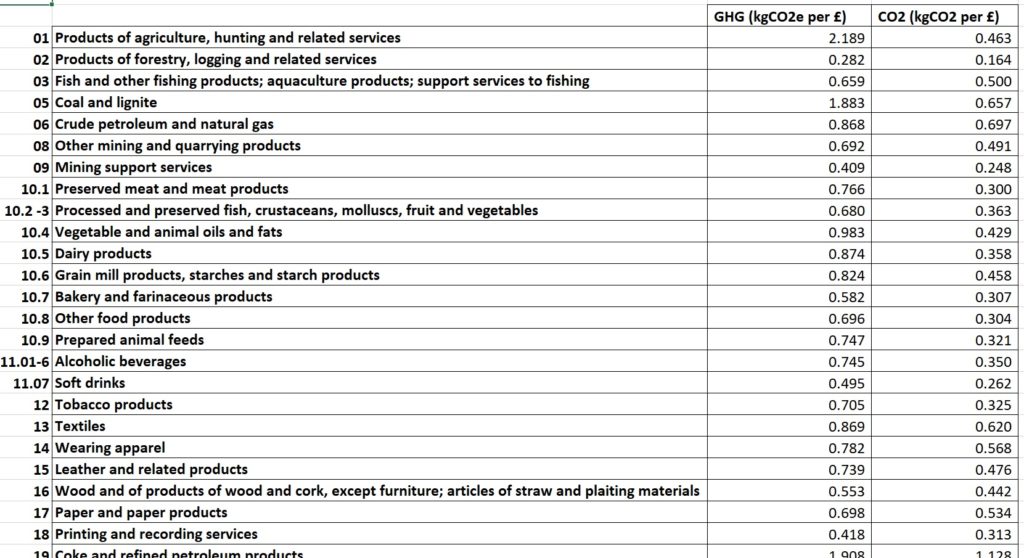
Essentially, that EEIO estimates the average carbon emissions (kgCO2e) per £ spent in a given industry sector – those used are actually globally based so include imports and exports as well as the UK’s own emissions (Multi-Region Input/Output – MRIO). Figure 3 shows examples of the values for 2019 used by Defra to estimate the UK’s overall carbon footprint (often called ‘Defra Table 13’) [9].
The EEIO methodology gives a very high-level and is necessarily very approximate because there is not yet in the UK let alone Globally, accurate carbon accounting across industry sectors to make accurate assessments. In addition they are very much averages and can not therefore generally be used to help with procurement decisions, e.g.
As the allocated footprint (kgCO2e) is based only on spending, if a company wanted to purchase lower carbon footprint products (say half the footprint of a standard product) and those products therefore cost more (say double the cost), EEIO would allocate double the footprint to the more environmentally friendly product, rather than half!
However, for corporate reporting it gives approximate averages and orders of magnitude where more accurate and meaningful data is not available.
This year we switched from using EEIO (kgCO2e/£) values provided in the SECR guidance to those given by Defra’s ‘Table 13’. That is because the Defra values were updated in 2019 where the SECR values date from 2009 and even allowing for inflation are likely less accurate. After discussion with the validating team at Carbon Footprint Ltd. they agreed it would be more appropriate to use the Defra ‘Table 13’ intensities than those in the SECR. In doing that we used the ‘Table 13’ factors retrospectively to our 2020/21 footprint – the comparisons here are based on those updated figures, so it is like-for-like.
As I said, the year on year comparison of supply chain Scope 3 is complex, one reason for the increase is that we included categories that didn’t last year. That was because last year we were new to the process and uncertain how to include them or they did not exist. Those additions include Rent, Training and Space Hire. There was also less use of 3rd party consultants but more use of ‘General Business Services’, in particular recruitment services, etc. The net change is a mix of many factors.
There was an increase of about 15% in the footprint of AWS (Amazon Web Services) – our primary digital service platform used to provide customer services and our largest single service footprint component. This was simply a reflection of increased spending given the EEIO footprint methodology. Although it is not clear how much that increase in spend reflects, direct increase in resource use, e.g. the cost increase was amplified by exchange rate changes between the $ and £.
AWS is doing a great deal to improve its environmental performance [10] and does provide a tool for customers to estimate their carbon footprint due to their use of AWS [11]. However, as regards the customer footprinting tool, as yet, there is very limited information about underlying methodologies used to make the estimates provided in the tool. In addition the tool only covers Amazon’s own Scope 1 and Scope 2 emissions, for which they use the Market-based emissions (rather than Location-based). In Epimorphics case, that value is Zero kgCO2e/year, since AWS have purchase power agreements or purchase Renewable Energy Certificates and Guarantees of Origin to cover the electricity used in the UK where our AWS services are hosted. .
Given that the AWS methodology is not yet clear, the scopes are limited and a location-based emissions estimate is not available, we choose to use EEIO estimates, which leads to a much larger footprint. In the future assessments, we hope that AWS will have refined the tool and documentation to provide a well founded carbon footprint estimate for customer use of their services as a product carbon footprint.
Next Steps
As you can probably tell from the notes above, we have continued to learn a great deal about the nitty-gritty of carbon accounting in conducting our second formal assessment.
Now we have done the assessment and had it validated, we will reflect on next steps and strategies for future reductions and how, and whether, to purchase offsets to cover our annual emissions, as we did last year.
We have concerns about offsets, in that we are aware that they risk of giving the impression of reducing emissions of a business model to ‘zero’ and so inadvertently enable avoidance of taking quicker more concerted effort. In addition there are ongoing reports and debates about the validity of some kinds of certificated offset schemes. However, we also want to take responsibility for those emissions we do have at present and offsetting is one way to do that. That is perhaps part of a topic for a future blog item!
See our Sustainability Summary Statement page, which we will be updating for further background on our sustainability policies and practices.
References
[1] ‘Good Energy doesn’t greenwash’, Good Energy (Oct 2022) https://www.goodenergy.co.uk/learn/greenwashing/
[2] ‘Differences between green energy suppliers’, Which! (Nov 2022) https://www.which.co.uk/reviews/energy-companies/article/green-energy-suppliers/differences-between-green-energy-suppliers-aN19W0B8B2Mc
[3] That’s simply because, if we did not use the electricity we have, it is likely that the renewable generation in 2022 in the UK would still have been just what it was, and the electricity we used contributed to the use of the marginal electricity supply, i.e. the fuel used to generate next kWh of electricity due to an increase in demand – which in the UK is nearly always the gas generation
[4] How much do you save in carbon emissions by being a Good Energy customer? https://www.goodenergy.co.uk/how-much-do-you-save-in-carbon-emissions-by-being-a-good-energy-customer/
[5] Ofgem say for a medium household the Gas usage per year is 12,000 kWh and Electricity about 2,900 kWh. Using the UK Government reporting carbon intensities for Gas and Electricity for 2022 that would be 2191 kgCO2e (Gas) and 561 kgCO2e (Electricity) total 2752 kgCO2e
https://www.ofgem.gov.uk/energy-advice-households/average-gas-and-electricity-use-explained
[6] Homeworking emission Whitepaper (EcoAct, 2020) https://info.eco-act.com/hubfs/0%20-%20Downloads/Homeworking%20emissions%20whitepaper/Homeworking%20Emissions%20Whitepaper%202020.pdf
[7] Homeworking tab of ‘Conversion factors 2022: full set (for advanced users)
https://assets.publishing.service.gov.uk/government/uploads/system/uploads/attachment_data/file/1083855/ghg-conversion-factors-2022-full-set.xls
[8] Environmental Reporting Guidelines: Including streamlined energy and carbon reporting guidance, HM Government, March 2019 https://assets.publishing.service.gov.uk/government/uploads/system/uploads/attachment_data/file/850130/Env-reporting-guidance_inc_SECR_31March.pdf
[9] UK and England’s carbon footprint to 2019 https://www.gov.uk/government/statistics/uks-carbon-footprint
[10] Sustainable Cloud Computing | Amazon Web Services https://aws.amazon.com/sustainability/
[11] Customer Carbon Footprint Tool, https://aws.amazon.com/aws-cost-management/aws-customer-carbon-footprint-tool/
[12] 2022 Government Greenhouse Gas Conversion Factors for Company Reporting Methodology Paper for Conversion factors (Draft Report), Department for Business, Energy & Industrial Strategy, June 2022
https://assets.publishing.service.gov.uk/government/uploads/system/uploads/attachment_data/file/1083857/2022-ghg-cf-methodology-paper.pdf#page=27
Referenced from “Greenhouse gas reporting: conversion factors 2022”, Department for Business, Energy & Industrial Strategy, Published: 22 June 2022 https://www.gov.uk/government/publications/greenhouse-gas-reporting-conversion-factors-2022
[13] https://www.nationalgrideso.com/future-energy/our-progress/carbon-intensity-dashboard
[14] Britain’s Electricity Explained: 2022 Review, National Grid ESO, 6th January 2023 https://www.nationalgrideso.com/news/britains-electricity-explained-2022-review