

Epimorphics commitment to reducing our carbon footprint and achieving net zero
Supplier name:
Epimorphics Ltd
Publication date:
24th August 2026
Document version: 2.0
Commitment to achieving Net Zero
Epimorphics Ltd is committed to achieving Net Zero emissions by 2050.
Baseline Emissions Footprint
Baseline emissions are a record of the greenhouse gases that have been produced in the past and were produced prior to the introduction of any strategies to reduce emissions. Baseline emissions are the reference point against which emissions reduction can be measured. Note that our Financial year runs from 1st October to 30th September.
Baseline Year: 2020/21
| Additional Details relating to the Baseline Emissions calculations |
| 2020/21 (financial year Oct 2020 – Sept 2021) was our first independently verified GHG footprint1 and we have chosen that year as our baseline year. We started systematically footprinting the previous year, 2019/20, using the same methodology. That year, being partly pre-covid this was significantly higher in the PPN 06/21 reporting categories (20.91 tCO2e/year) than our chosen baseline year of 2020/21 (16.94 tCO2e). However, as that was not independently verified, hence our choice of 2020/21. We have provided both location-based and market-based emissions. |
Baseline year emissions:
| EMISSIONS | TOTAL (tCO2e) |
| Scope 1 | 0.98 tCO2e |
| Scope 2 | 0.83 tCO2e (location-based) 0.0 tCO2e (market-based) |
| Scope 3 (Including Sources) | Category 4. Upstream transportation and distribution = 0.00 tCO2e Category 5. Waste generated in operations = 0.22 tCO2e Category 6. Business travel = 0.38 tCO2e Category 7. Employee commuting = 0.00 tCO2e (Covid meant home working) Category 7. Home Working (HW) = 14.53 tCO2e Category 9. Downstream transportation and distribution = 0.00 tCO2e Total Scope 3 (categories 4,5,6,7 & 9) = 15.13 tCO2e |
| Total emissions | 16.94 tCO2e 16.11 tCO2e (market-based) |
Current emissions reporting
Reporting Year: 2024/25
Our GHG Footprint Verification has been undertaken by Carbon Footprint Ltd.
| EMISSIONS | TOTAL (tCO2e) |
| Scope 1 | 0.0 tCO2e |
| Scope 2 | 0.0 tCO2e (location-based) 0.0 tCO2e (market-based) |
| Scope 3 (Including Sources) | Category 4. Upstream transportation and distribution = 0.00 tCO2e Category 5. Waste generated in operations = 0.00 tCO2e Category 6. Business travel = 0.18 tCO2e Category 7. Employee commuting = 0.53 tCO2e Category 7. Home Working (HW) = 5.84 tCO2e* Category 9. Downstream transportation and distribution = 0.00 tCO2e Total Scope 3 (categories 4,5,6,7 & 9) = 6.55 tCO2e |
| Total emissions | 6.55 tCO2e 6.55 tCO2e (market-based) |
* We have improved our Home Working emissions methodologies through improved home working employee survey detail and a switch to using regional (rather than national) average domestic heating energy usage (see ‘Completed Carbon Reduction Initiatives’ below)
Emissions reduction targets
Our scope 1 and 2 emissions have reduced to zero as of Aug 2024 as we transitioned to fully remote working.
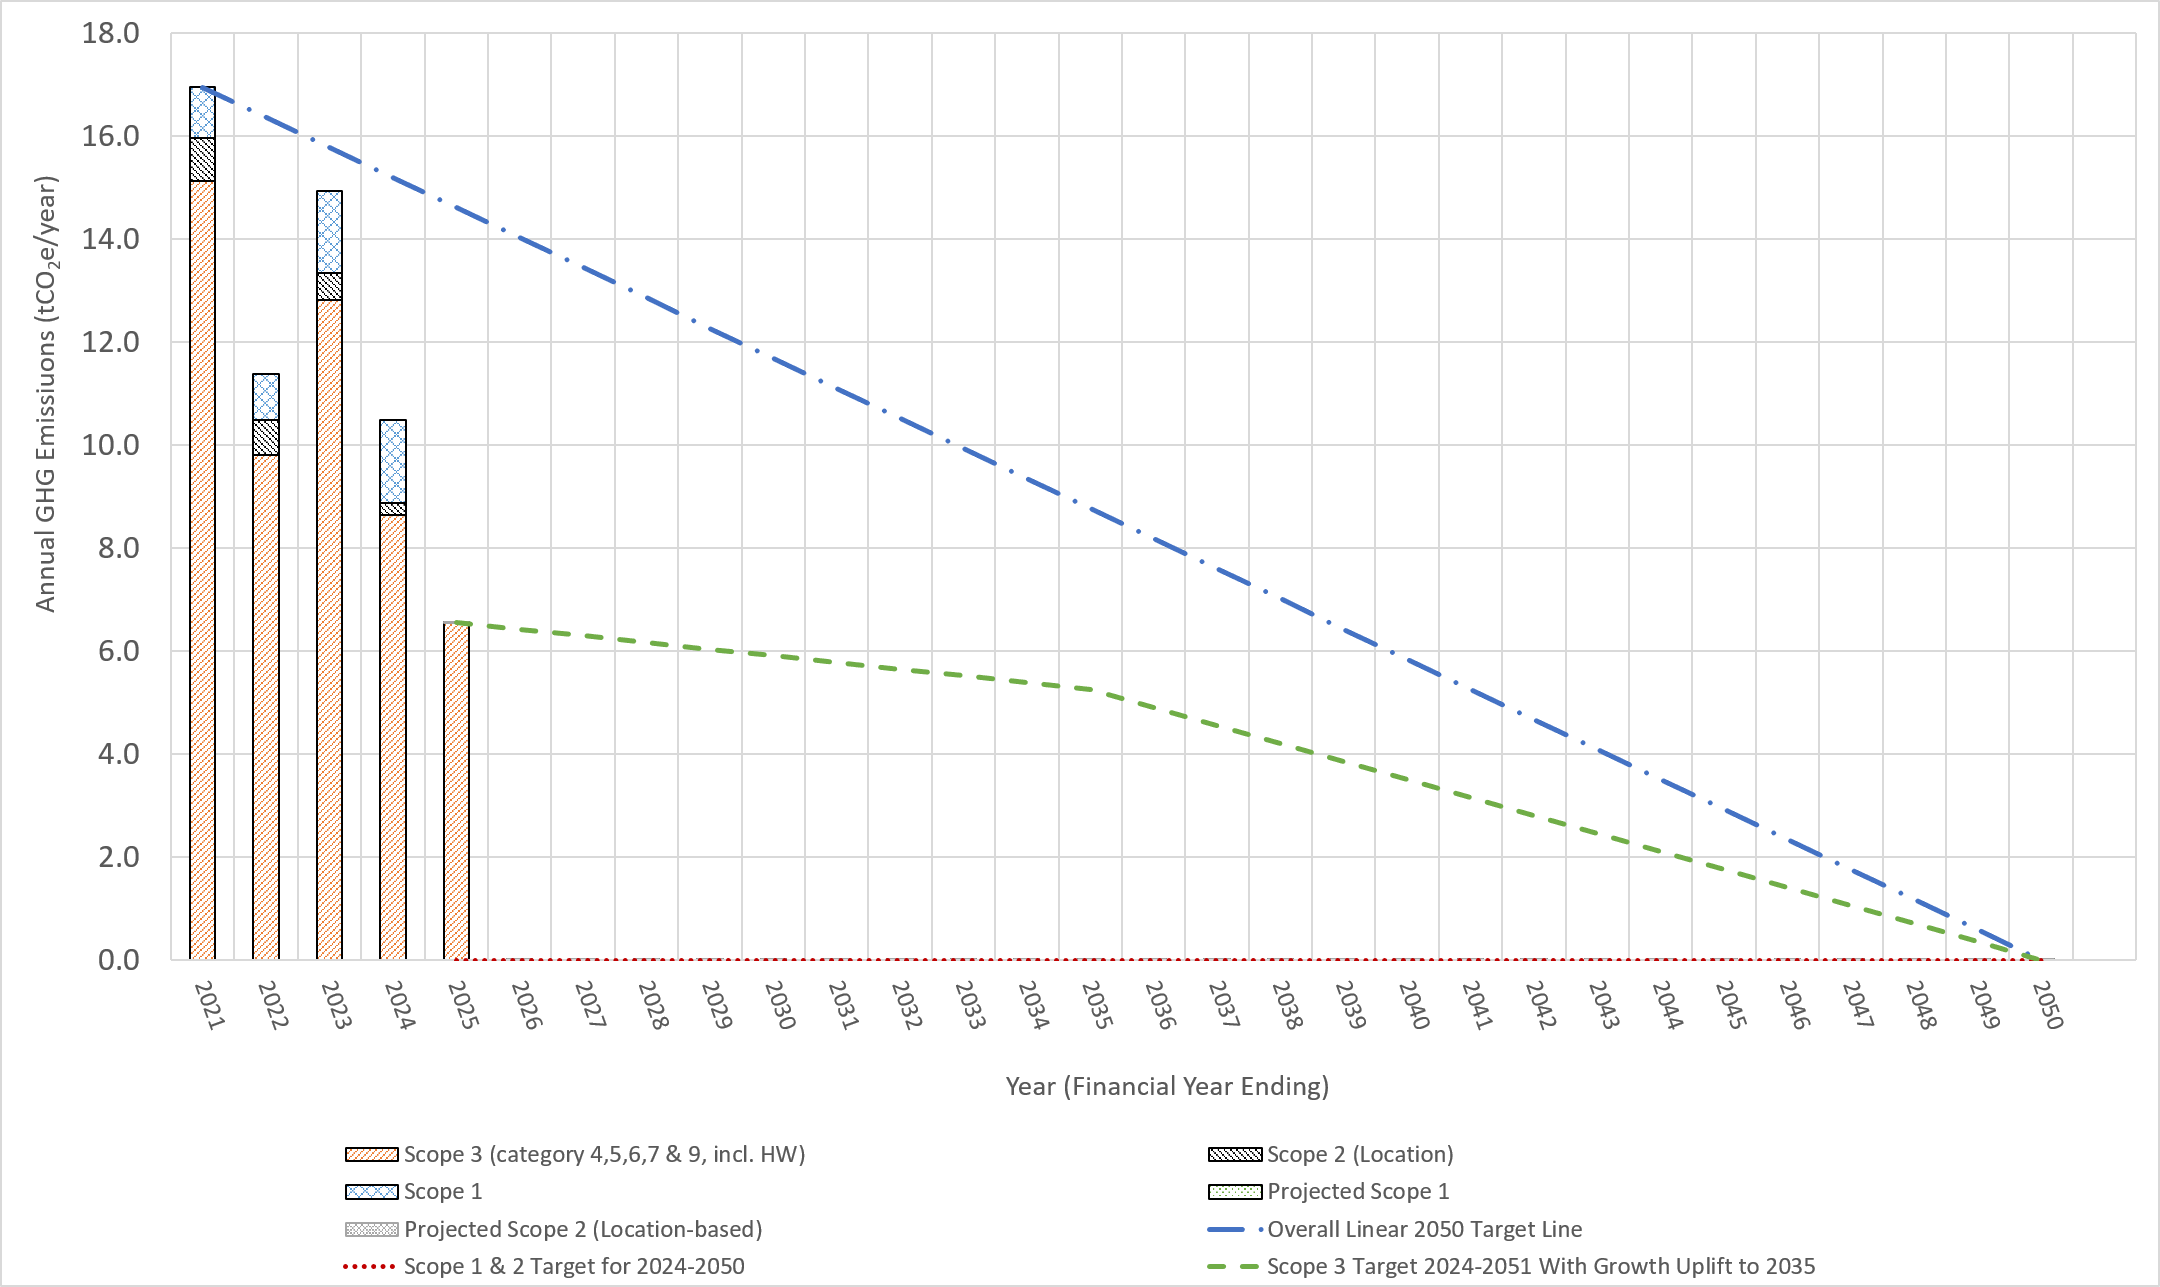
In order to continue our progress to achieving Net Zero, we have adopted the following carbon reduction targets. We recognise that for a growing SME, medium term projections are complex. However, we project that our remaining Scope 3 carbon emissions will decrease over the next five years in line with UK grid, heating and transport emission reductions – based on the UK Climate Change Committee’s Seventh Carbon Budget (2025) Balanced Pathway – using a weighted sum of projected residential emissions and surface transport emissions with a small allowance for expected business growth. We currently expect that to result in a reduction to below 6.0 tCO2e by 2035.
Progress against these targets can be seen in the graph (Figure 1) below:
Carbon Reduction Projects
Completed Carbon Reduction Initiatives
We have been conducting GHG footprinting since 2019 to quantify our emissions, built on previous work to actively monitor and model our energy (electricity and gas) use since 2017. We have worked with Carbonfootprint Ltd to verify our assessments from 2020/21, so that we were sure our assessments were valid.
As reported last year (2024), we have moved to fully remote working (as of Aug 2024) and so no longer have a permanent office. Subsequently our scope 1 or 2 emissions have dropped to zero tCO2e/year.
While it is not reported within the PPN 06/21 Scope 3 reporting categories we also quantify and report (and have been verified by Carbonfootprint Ltd) our supply chain GHG emissions (Category 1: Purchased Goods and Services) where possible using validated product or service footprints from suppliers, and where those are not available, using the spend based methodology as per Streamlined Energy and Carbon Reporting (SECR).
In addition we have practices and policies in place to reduce or maintain low emissions and improve the accuracy of our GHG emissions reporting:
- Lower Carbon Cloud Services – we deliver support and host software on cloud services, chosen in-part for their carbon-reduction plans. We select data centre locations that optimise those reductions based on data and reporting available from our Cloud Service Provider (AWS). Our hosted services also show as running on ‘green energy’ by the green web foundation.
This year following significant methodological improvements in AWS’ Sustainability Console (providing AWS’ customers with estimated service carbon footprints), e.g. to include location based emissions and the majority of their Scope 3 emissions, and also taking advice from our carbon footprint verifiers, we have used the AWS provided carbon emissions estimate for our use of AWS services. However, for transparency and continuity, we continue to retain the equivalent spend-based estimate alongside the AWS figures so that historical comparisons remain possible and methodological differences are visible. It is worth noting that this year, because of the changes in spend-based multipliers (see below) the emissions estimated by the AWS customer footprint is for the first time higher than the spend-based method.
We recognise the operational impact of our service/software design choices we make and aim to design efficiently. We deliberately scale services to meet the need, not adding additional resources that increase costs and energy use/carbon emissions. For example: We actively look to minimise costs for clients, with the engineering choices we make, this includes minimising the infrastructural footprint of the cloud infrastructure and turning off development infrastructure when it is not actively being used, we use cost as a proxy for the energy-use of these services. - We use computer hardware and other equipment for as long as is practical which reduces the embodied carbon emissions of purchasing equipment, e.g. the average lifetime of our laptops is about 5-7 years where Life Cycle Assessments for laptops and desktops equipment generally assume 4 years. Where possible equipment is gifted for continued use when replaced, e.g. laptops and other office equipment is generally gifted to staff, educational or voluntary organisations or others for continued use, following appropriate information-security assessments.
- Travel policy – our travel policy is designed to help minimise carbon emissions. Unless there is a specific business need for face to face meeting, meetings are held using video/audio conferencing technologies. Train is the preferred means of transport for UK based meetings and the use of air transport is kept to a minimum and used only where there are strong business reasons and alternatives (e.g. train) are not appropriate. Business travel is monitored and has been continuously reducing since 2019/20.
- Our move to fully remote working has meant an increase in commuting travel emissions due to travel to and from our hired meeting and hot-desk venue. We will monitor commuting and business travel on a quarterly basis in order to understand and manage the possible increase in business travel emissions. We have improved our commuting travel monitoring by systematically logging attendance and travel for attending our hired meeting and hot-desk venue.
Meeting and hot desk venue emissions are tracked and reported as part of our Scope 3 Purchased Goods and Services assessment - We have updated our business travel claim forms to provide detailed vehicle and journey specific information to enable more accurate emissions information.
- While it does not show up in our PPN 06/21 above – because it is not a PPN 06/21 reporting category. There have been significant changes to our Scope 3 category 1 (purchased goods and services) due to changes in UK Gov spend-based multipliers – these constitute approx. 74% of our overall more comprehensive verified carbon footprint.
This year 2026, UK Gov has made significant changes to the data sources used to estimate the spend-based multipliers for estimating supply chain footprints (i.e. Category 1: Purchased Goods and Services). The changes are retrospective to 2010. The changes have significantly reduced the estimated footprints for some of Scope 3 supply chain emissions (not included in the Carbon Reduction Plan categories, so it makes no difference to our CRP). Our footprint verifier has advised that we should retrospectively update our Scope 3 emissions accordingly, to our baseline year of 2020/21, which we plan to do before the assessment of our 2025/26 footprint. - Because home working is a major emissions hotspot (81% of PPN 06/21 Scope 3 categories for 2024/25), we have worked, with our footprint verifiers, to improve our, home heating calculation methodology, in two ways:
- 1. adding a more refined question about occupancy with three options to distinguish between, i) only home-worker in the home, ii) home would normally be occupied by at least one person who was not also home working and iii) other person/people present but in all cases, only because they are also home working. We assign 100% if only the home worker, 50% if only other home workers and 0% if a non-home worker. Previously we only asked if the home would have been occupied by another person.
- 2. We have switched to using regional average (i.e. local authority average, rather than national average) domestic heating energy usage (data provided by UK Government) when in the calculations to estimate our homeworking emissions. Since heating is approx. 89% of our homeworking emissions, changing to a more location specific activity data is a significant improvement in data quality. In future we plan to improve this further by gathering usage data though our annual staff survey.
In the future we plan to implement further measures including:
- We plan to gather more specific home heating data from our employee survey in coming years, where specific data is not available we will use post code specific gas usage (see above) rather than the regional figure we currently use.
- We assess, manage our ESG (Environmental, Social and Governance) risk and compliance, and manage our corporate sustainability goals using the Ecovadis platform, which are available to other scheme members.
- While Scope 3 Category 1 (purchased goods and services) is not part of PPN 06/21 reporting it is approximately 80% of our overall validated carbon footprint. To improve our Category 1 reporting, we plan to continue striving to use product carbon footprints (PCF) for supply chain purchases, where that’s possible and reliable, rather than the highly inaccurate spend based method. We will work with our footprint verifiers to ensure that those used are appropriate and meet required standards.
Declaration and Sign Off
This Carbon Reduction Plan has been completed in accordance with PPN 06/21 and associated guidance 9 and reporting standard for Carbon Reduction Plans.
Emissions have been reported and recorded in accordance with the published reporting standard for Carbon Reduction Plans and the GHG Reporting Protocol corporate standard and uses the appropriate 10 Government emission conversion factors for greenhouse gas company reporting. 11
Scope 1 and Scope 2 emissions have been reported in accordance with SECR requirements, and the required subset of Scope 3 emissions have been reported in accordance with the published reporting standard for Carbon Reduction Plans and the Corporate Value Chain (Scope 3) Standard. 12
This Carbon Reduction Plan has been reviewed and signed off by the board of directors.
Signed on behalf of Epimorphics Ltd
Alex Coley, Managing Director
Date: 24/08/2026
1 Verified, as being in accordance with the GHG Protocol, by Carbonfootprint Ltd, Belvedere House, Basing View, Basingstoke,
Hampshire, RG21 4HG, UK
2 Note: our financial year is 1 October – 30 September. The chart x-axis is for the year end, e.g. 2024 is for our financial year
2023/24
3 goodenergy.co.uk/our-energy and
which.co.uk/reviews/energy-companies/article/green-energy-suppliers/differences-between-green-energy-suppliers-aN19W0B8B2Mc Also see Ofgem website
ofgem.gov.uk/decision/decision-issue-good-energy-limited-and-good-energy-gas-limited-enduring-derogation-renewable-standard-variable-tariffs-default-tariff-cap
4 goodenergy.co.uk/blog/carbon-offset-gas-good-for-environment and goodenergy.co.uk/wp-content/uploads/2024/01/GE-Assurance-Document-2022-23.pdf
5 www.epimorphics.com/sustainability-summary-statement
6 www.thegreenwebfoundation.org
7 aws.amazon.com/aws-cost-management/aws-customer-carbon-footprint-tool
8 e.g. (HP) h20195.www2.hp.com/v2/getpdf.aspx/4AA8-1898ENW.pdf, (Apple) Appendix A of apple.com/environment/pdf/Apple_Environmental_Progress_Report_2023.pdf, (Lenovo) static.lenovo.com/ww/docs/regulatory/eco-declaration/pcf-thinkpad-e15-2nd-intel.pdf
9 gov.uk/government/publications/procurement-policy-note-0621
10 ghgprotocol.org/corporate-standard
11 gov.uk/government/collections/government-conversion-factors-for-company-reporting