
Our delivery manager Tom Guilbert highlights the updated API that underpins the Environment Agency’s continuous monitoring archive that we designed, built and run. The API is a way to access the massive volume of data behind the Hydrology Data Explorer.
Introduction
This blog follows on from a previous #TechTalk post about a new and hugely expanded version of the Environment Agency’s (EA) Hydrology Service that we’ve been working on. I will introduce how you can access the data via an Application Programming Interface (API).
What is an API?
If you’re creating a report, a data visualisation, or training a model, it’s often helpful for your code to be able to access data directly, rather than waiting for you to download it every time there’s an update. An API, or Application Programming Interface, is a way for code to directly search, filter and extract data from an online dataset. The Hydrology Service includes an open RESTful API, which can serve data in various formats, including JSON and CSV, that you can access via Python, Excel, JavaScript or whatever tool or programming language that you are using.
Hydrology API
The Hydrology Service publishes over four billion individual readings of the water environment taken by EA sensors at about 8,000 monitoring stations across England. Readings are collected into over 25,000 measurement time series based on the parameter, time between readings and monitoring station they were taken at. For an introduction to the key terms used in the data see the service help page.
To give user-friendly access to this data we have built the Hydrology Data Explorer web application using the API. But this is just one way to present the data and there are myriad other ways that it could be used and combined with other data sources. To help promote data reuse and innovation EA have made the API open and the data it serves is available for everyone to access and reuse as they wish under the Open Government Licence.
Our detailed API guidance should help developers quickly understand how to shape the data to their requirements. Please note the fair use section and the limits on the amount of data that can be accessed with one call. Our batch API can be used if you want to schedule large extracts, which may be the subject of a future blog.
If you have any questions then the EA should be the first port of call for support, but if you have any ideas for more complex use of the API then we’d also be happy to help so please get in touch.
Our ethos is to encourage reuse of the data, and help promote exploration and understanding of the data and the environment. Here are some simple examples of how the API can be used, written by a non-technical delivery manager with an interest in the data (me):
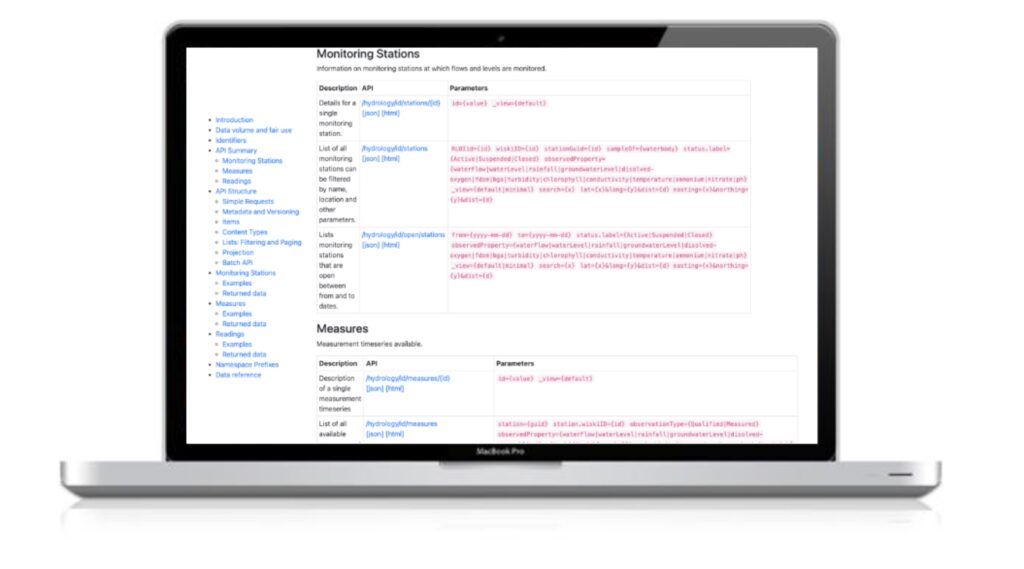
Monitoring Stations
The first thing you’re likely to want to do when you start working with this data is to narrow down the locations that you’re interested in by using the stations endpoint. The key ways to do this are by location and by the parameter being monitored (although there are others – see the API documentation).
Location
All stations have a grid reference so they can be mapped. To find the stations near a location use an API call like the one below where ‘lat’ is the latitude and ‘long’ is the longitude of the search, and ‘dist’ is the distance in kilometres from that point:
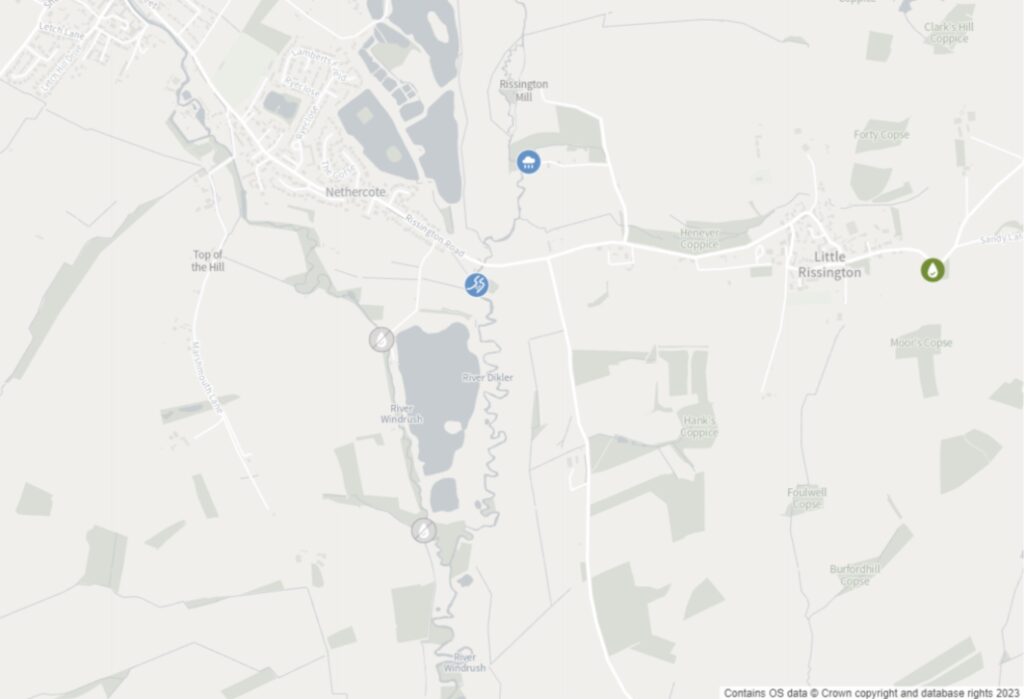
https://environment.data.gov.uk/hydrology/id/stations?lat=51.87485&long=-1.73999&dist=1This call will take you to a web page listing the five stations that meet the search criteria. You will see that each carries a whole load of other data about the station, which can be used to filter down further.
Here is a map plotting those stations:
Parameter
You’ll notice that the five stations I found all have a property called ‘observedProperty’, which identifies the parameters measured at the site. If you are interested in water quality data in this area then you can narrow the search further by adding to your call as follows:
https://environment.data.gov.uk/hydrology/id/stations?lat=51.87485&long=-1.73999&dist=1&observedProperty=dissolved-oxygenThis reduces the results to three water quality sites that have been in operation in the local area since 2018.
If you are interested in flow data then replace ‘dissolved-oxygen’ with ‘waterFlow’:
https://environment.data.gov.uk/hydrology/id/stations?lat=51.87485&long=-1.73999&dist=1&observedProperty=waterFlow
This will reduce the list to a single station: Bourton-on-the-Water Dikler which is identified by the URI:
https://environment.data.gov.uk/hydrology/id/stations/fdfac74b-f168-40d6-9f97-2efc9ac6a964Following this link provides full details of the station and its measurement time series.
If you’re writing this query to use from a script or program then you might prefer to see the data in a programmer-friendly format like JSON. To do that simply add ‘.json’ to the end of the main part of the URL:
https://environment.data.gov.uk/hydrology/id/stations.json?dist=1&lat=51.87485&long=-1.73999&observedProperty=waterFlowMeasurement Time Series
Once you have your stations of interest you can find the time series available for them using the measures endpoint. Remember these are the individual datasets containing all the readings over time for a parameter with a particular interval at a station. The API call above that returns details of Burton-on-the-Water Dilker monitoring station lists the following time series on the ‘measures’ property:
- Daily mean flow
- Daily min flow
- Daily max flow
- 15 minute flow
- Daily min level
- Daily max level
- 15 minute level
Each one has various properties that describe the data content, for example the units, the interval in seconds between readings and a link back to the station they are taken from.
Like the stations endpoint, the measures endpoint can be filtered in a number of ways to discover data you’re interested in. I will show how to filter by station and parameter but see the guidance for details of the other options.
Station
To explore the time series available for a station just add ‘/measures‘ to the URL for the station. For example:
https://environment.data.gov.uk/hydrology/id/stations/fdfac74b-f168-40d6-9f97-2efc9ac6a964/measuresYou can also list all measures across the service and then filter them. For example, to filter by the station they come from use the ‘station’ parameter:
https://environment.data.gov.uk/hydrology/id/measures?station=fdfac74b-f168-40d6-9f97-2efc9ac6a964The URIs returned for each measure on this station are made up of the ID for the station and the measure. If you know these IDs for other stations or measures then you can use them to find other time series in the service and the readings they contain (see below for more on readings).
Parameter
To find measures for particular parameters you can add them to a call in a similar way to the stations endpoint. Here I’ve added ‘observedProperty=nitrate’ to narrow down the list of all time series to nitrate:
https://environment.data.gov.uk/hydrology/id/measures?observedProperty=nitrateReadings
Of course the really interesting data in the service is the readings so how do we access these?
Well, once you’ve explored the stations and measurement time series, if you want readings from a single time series you can use a call to the measures endpoint like this, which pulls back the daily mean flow data for Burton-on-the-Water Dilker monitoring station:
https://environment.data.gov.uk/hydrology/id/measures/fdfac74b-f168-40d6-9f97-2efc9ac6a964-flow-m-86400-m3s-qualified/readingsAs this time series starts in 1995 that is quite a lot of readings. To see when the time series started use:
https://environment.data.gov.uk/hydrology/id/measures/fdfac74b-f168-40d6-9f97-2efc9ac6a964-flow-m-86400-m3s-qualified/readings?earliestYou can download the readings in CSV or JSON format by adding the format extensions as explained earlier (this is possible for all calls to the Hydrology API):
https://environment.data.gov.uk/hydrology/id/measures/fdfac74b-f168-40d6-9f97-2efc9ac6a964-flow-m-86400-m3s-qualified/readings.csv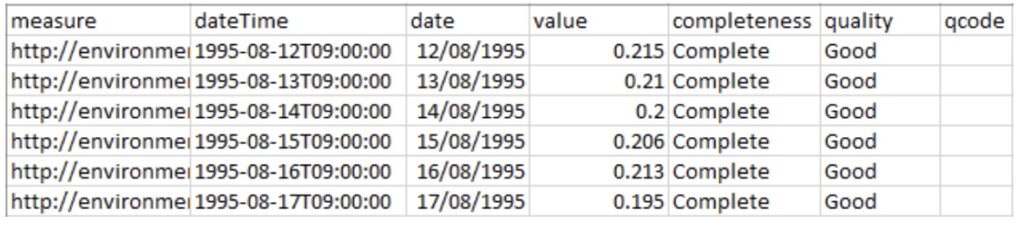
Each reading has a date-time stamp, a value (usually) and the identifier for the measurement time series. For qualified data there can be quality flags, and readings with the quality annotation ‘Missing’ will not include a value at all.
If you just want data for a certain period you can add the ‘mineq-date’ and/or ‘maxeq-date’ inclusive date parameters. For example the following call provides all the daily mean flow readings from 1st January to 31st March 2023 inclusive in CSV format:
https://environment.data.gov.uk/hydrology/id/measures/fdfac74b-f168-40d6-9f97-2efc9ac6a964-flow-m-86400-m3s-qualified/readings.csv?mineq-date=2023-01-01&maxeq-date=2023-03-31To access readings from more than one time series you’ll need to use the readings endpoint. For example the latest readings at Burton-on-the-Water Dilker monitoring station can be found by defining the ‘station’ parameter and adding ‘latest’ like this:
https://environment.data.gov.uk/hydrology/data/readings?station=fdfac74b-f168-40d6-9f97-2efc9ac6a964&latestTo return readings from different stations in the same call there are a number of ways you could build your query, but the simplest is to list the measures as follows (which returns the latest daily mean flow at Burton-on-the-Water Dilker and the latest total rainfall at the nearby Burton rainfall station we discovered at the start of this blog):
https://environment.data.gov.uk/hydrology/data/readings?measure=fdfac74b-f168-40d6-9f97-2efc9ac6a964-flow-m-86400-m3s-qualified&measure=bf217aec-f418-42a6-9b0f-a3de46d7c592-rainfall-t-900-mm-qualified&latestWho is using the API?
Hopefully that gives you a basic overview of the Hydrology API and the power it gives anyone wanting to access this enormous archive of data. We know that several water companies and software developers working on flood modelling are using it already. We would love to hear more if you have an idea or are already making use of the service.
Let us know if you are using the data or API in a project!
As an update we have also made available a version of the API in the openAPI spec at https://environment.data.gov.uk/hydrology/doc/oas in both json and html formats.