
Introduction
When I left the Environment Agency (EA) to join Epimorphics I knew I was likely to continue working with environmental data. That was one of the things that attracted me to move. It has been a brilliant first year at Epimorphics and I’ve enjoyed working on a wide range of different things. But it is still surprising quite how close to home my first environmental data project here has been. This blog post celebrates the release of a new and hugely expanded version of the Hydrology Service that we’ve been working on.
The data
My last role at the EA was managing a programme to upgrade and harmonise their regional telemetry systems, which are used to collect real-time data about the water environment like river levels, river flow, rainfall, groundwater levels and the operation of water management assets like pumps and sluice gates. This data is critical to many of the EA’s most important functions, especially forecasting and warning the public about flooding, managing flood and drought incidents, and ensuring there is sufficient water in the environment to support wildlife.
The data is archived to EA’s internal WISKI system, where it’s quality checked and curated for use by professional hydrologists. Epimorphics have supported EA in publishing some river flow data from this archive, in conjunction with live telemetry, at https://environment.data.gov.uk/hydrology since 2018. Our latest extension to the service expands the range of measurement parameters and the number of sampling sites. It also increases the resolution of most measurement series to 15 min sampling frequency. With sites across the whole of England and some time series stretching back many decades this represents a 1,000-fold increase in data volumes with over four billion rows of readings now accessible through the service.

River Flow stations – include flow readings taken every 15 minutes, as well as daily mean, min and max flows. Most also include river level data for the same location

River Level stations – include the depth of the river every 15 minutes, as well as daily min and max readings

Rainfall stations – include the total rainfall every 15 minutes and for each day. Sometimes these are co-located with River Flow and River Level sites

Groundwater Level stations – include either one-off ‘dipped’ levels (generally read once a month), or hourly level data when logging equipment is fitted. Some stations contain a mix of both types.
As well as this water quantity data, the EA also uses telemetry to collect real time water quality data. This is handled via a different system but we have brought it into the same service so that the data is presented together with the water quantity archive for the first time:
Water Quality stations – measure a range of different parameters every 15 minutes. Dissolved oxygen is always measured, often complemented by temperature, pH, conductivity, turbidity, nitrate, salinity, blue green algae, chlorophyll, fluorescent dissolved organic matter or ammonium. Because these sites often only operate for a few months, the archive is mostly made up of closed sites. All historical data that can be shared has been made available
We have used linked data approaches to publishing the metadata about the sites, parameters and measurement series (would you expect anything else from Epimorphics!?) This gives a flexible and open-ended way for the data to be organised, searched and referenced / linked to from other services. For the high volume readings data we have used scalable cloud native relational database technology – I’ll leave others to explain that in more detail another time…
The data is provided via a web API that allows both data and metadata to be retrieved in JSON, CSV or Linked Data formats, making it easy for users to work with the data. To help users without the skills to access an API we have also used it to build an explorer web app to search, view and download the data.
Web application
We have built on the existing Hydrology Explorer application to help data users navigate this archive of over 4 billion readings. It provides map browse, filter and search functions to help you find the sites you are interested in.
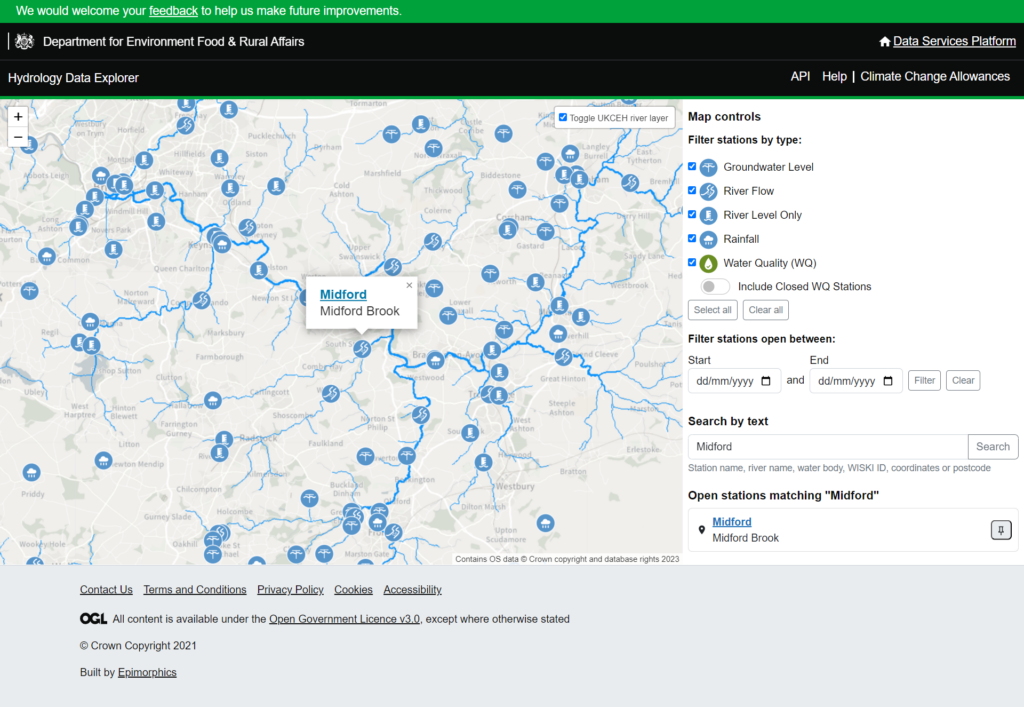
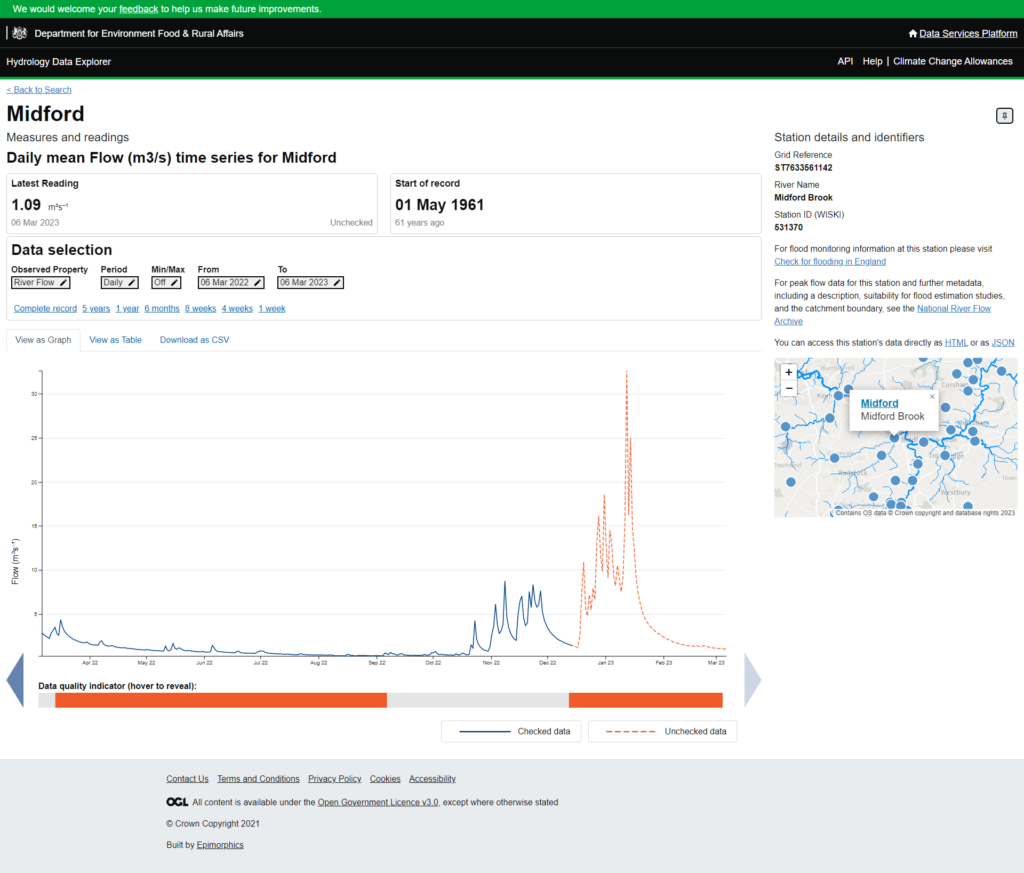
Once you have found your site you can drill into the measurement series to view or download different time ranges and parameters. The site page also provides other information about the site and links to other resources, including the API pages that underlie the application (should you wish to access the data that way).
Summary
It’s been a real pleasure to work with colleagues old and new at EA and Epimorphics to deliver this project – hopefully I’ve helped not only with the delivery management that my job title suggests, but a little bit of knowledge about telemetry and hydrology data too!
Opening up access to all this data, making it available for re-use by community groups, the water industry, academia and in fact anyone that wants to use it, should unlock its value in myriad ways. I look forward to the next developments!
Interested in finding out more?
If you’re interested in finding out more, or would like to discuss how we could help you to publish similar data please get in touch.
Service Feedback
The Environment Agency is keen to get user feedback on the explorer to help prioritise future developments, so please complete their survey if you can.