myRivers started as a student group project at the University of Bristol. Initially, the main focus of the application was to submit images of pollution incidents in and around UK rivers. The application also provided very limited data from the Catchment Data Explorer (CDE) API provided by the Environment Agency.
At the start of the internship, we were able to meet with one of the potential user groups where we uncovered that there are a lot of implications with image submission, such as training requirements for the people using the application, and dealing with the pollution incidents. Therefore we decided to move the spotlight to the data and introduced three layers to the map, all showcasing data from a different dataset.
Using Catchment Data Explorer data
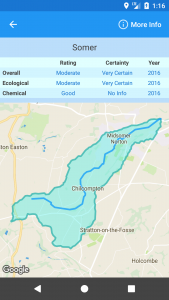
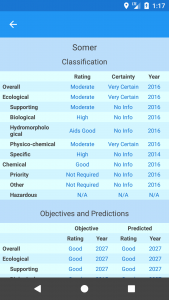
Catchment Data Explorer (CDE) contains detailed reports of river catchment quality in the UK. The initial version of the application was limited as it only displayed the basic river basin classifications(Overall, Ecological and Chemical). The latest version refines all classifications in subcategories, and incorporates objective and predicted classifications. Because all the data is related to the river catchments, I have decided to display catchment boundaries on the map with river lines overlaid; this was made fairly simple as CDE dataset provides this data in geoJSON format which is well supported by the Google Maps API.
Using the Water Quality Data Archive (WIMS) data
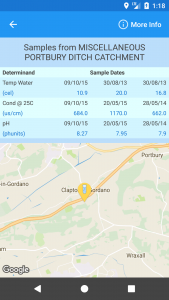
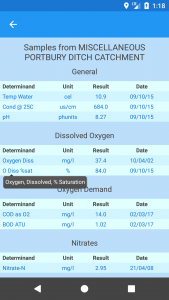
The Water Quality Data Archive provides data on water quality measurements. Samples are taken at designated points around England and can be from coastal or estuarine waters, rivers, lakes, ponds, canals or groundwaters. The dataset contains more than 3000 different determinands which had to be filtered out in order to fit on a mobile phone screen. I have analysed the number of measurements for each determinand, as well as the trend over the years, and filtered out the most frequently measured ones. I also decided to use the grouping set by the API. An example of WIMS data can be seen below.
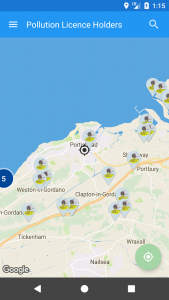
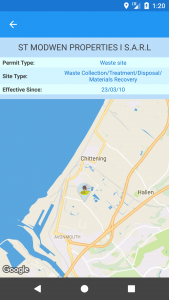
Using the Electronic Public Register (EPR) data
The Environment Agency licenses industry, business and individuals to carry out certain activities that have the potential to pollute the environment. Details about these licenses are available through electronic Public Register that we helped to build. My main focus was on a subset of this dataset, Water Discharge Permits, as they can directly affect the water quality in both coastal and estuarine waters. Information such as permit and site type as well as a holder name are all available to the users of the application as seen below.
myRivers can be found useful by anyone interested in the quality of UK rivers and catchment areas. Being a mobile app makes it really handy to use out in the field where you can directly relate the visible signs of river quality with the live data. It was available for both mobile devices and tablets and can be found on the Google Play Store.