
Andrew, our DevOps engineering lead, talks about his experiences securing infrastructure monitoring with OAuth2, when working on our infrastructure development. This post is one of our #TechTalk posts, that will focus on different areas of our work in the coming months.
Part One: the problem
The DevOps world has a mature eco-system of Third-Party applications to help the overburdened administrator know what’s happening with their system.
However these tools, often because they display the nature of underlying infrastructure so well, can be a significant asset to anyone wishing to gain unauthorized access to your systems with malicious intent.
There were times when no-one knew what a Threat Model was, tools were terminal based, systems lived in corporate server rooms behind firewalls, required VPN tunnels for access or could only be accessed from the same location. I’ve even worked on systems where the last line of defence was actually a dude on a warship with a gun (but I can’t talk about that one).
Nowadays it’s more likely your production system is running in the cloud and needs to be monitored from anywhere you can get an internet connection, is web-based and likely to be of interest to everybody from script-kiddies in Singapore to evil State operators.
If your system is Kubernetes based, the default means of access for secure applications is an ad hoc combination of port-forwarding and ssh-tunnels. These are a pain: they are difficult to diagnose if something goes wrong, you forget the exact command-line unless it’s written down somewhere etc, etc. If your system uses virtual hosts they can be prey for bot-net farms.
Fear not, relief is at hand.
Part Two: a better approach
Firstly get your systems as far from the internet as possible. Get them behind firewalls, reverse proxies and bastion servers, and secure your infrastructure tool-set with proper authentication with OAuth.
I’m not going to explain how OAuth (pronounced “oh-auth”) works, there are lots of examples of that elsewhere. If you *really* want to know then you should probably start here https://auth0.com/intro-to-iam/what-is-oauth-2
Many of the standard DevOps monitoring tools (Grafana, Kibana etc) have support for OAuth already built in. I’m not going to talk about that either, refer to the specific application documentation (then do so again when you upgrade the version because the likelihood is it will have changed! I mean, come on guys, you know who you are).
What I’m going to document here is a generic way to secure all elements of your tool-set using the same mechanism, so that adding another tool down the line is a simple cut-and-paste. It works anywhere you can get online, leaves the hard security stuff to people who [should] really know their stuff and works reliably for every member of your team. So no “works for me” issues.
I’m going to consider two types of publicly accessible infrastructure models. The first is various monitoring applications running behind a reverse proxy (the examples given will be for Apache). The second is Kubernetes based. It doesn’t matter if it’s managed in-house or by the cloud vendor but I’ll be using the Nginx Ingress Controller to route traffic to the various applications. In both cases access to the tooling is via these intermediary systems, which henceforth will be referred to as “the proxy” for brevity.
I did say I wasn’t going to explain how OAuth works, but we need a little bit of context. For this setup an OAuth Service Provider is required. These are a trusted organisation where you already have (or are willing to have) some identity or profile that is secured by some means of authentication (preferably multi-factor) and this organisation provides an OAuth service by an API. Examples include Azure Active Directory, Google, Github etc. For the purposes here I’m going to use Google as their documentation I found to be about the best.
We are going to configure our proxy (Apache reverse proxy or Nginx Ingress Controller) to only allow access to our infrastructure monitoring tool-set when authenticated by the OAuth service provided, i.e. Google.
The way this works: when the proxy receives a request to access one of our tools (say the Kubernetes dashboard) if the session doesn’t have an appropriate token, the request is redirected to our OAuth Provider (Google). The user is then challenged to authenticate (against their Google account) and if successful redirected back to our application (via the proxy) with an appropriate session token. Subsequent requests, because there’s a valid token go straight through.
There’s much more to it than that but you don’t need to know the details, apart from perhaps when tokens expire, re-authentication is then required. It’s all good, it’s all been thought of before by clever people so you don’t have to. It is the very essence of free gravy.
Part Three: Google OAuth API
The first thing to be done is configure the OAuth Service Provider. Other providers are available, consult their documentation for details on how to set them up. Google’s docs are here https://developers.google.com/identity/protocols/oauth2/javascript-implicit-flow#creatingcred
- So go to the Google API Credentials page https://console.developers.google.com/apis/credentials
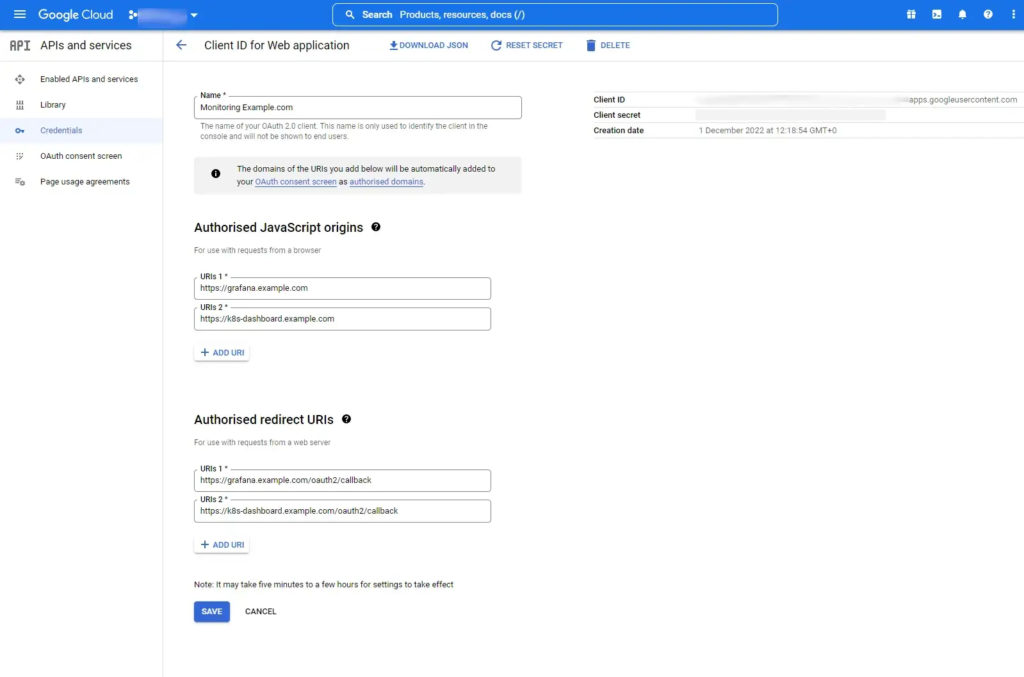
- Create a OAuth Client ID for Web Applications
- Add URLs for each of your monitoring applications and define a redirect for each. The redirects are the same as the applications URL with the addition of
/oauth2/callback. See Figure 1, below: - Take note of the Client ID and Client Secret. You’ll need these later. The Client ID is your Google Organisation, some will probably always be the same.
- You can create multiple blocks of these URLs. So maybe a block per Kubernetes cluster, per environment, per customer installation. It matters not, as long as they share a proxy. So the same value for each virtual host in a web server or for each ingress under a single controller.
Part Four: Apache Reverse Proxy Configuration
In order to direct requests to for monitoring tools to the Google API, Apache requires the mod_auth_oidc module and the following configuration:
# Global Settings
OIDCProviderMetadataURL “https://accounts.google.com/.well-known/openid-configuration"
OIDCClientID xxxx
OIDCClientSecret xxxx
OIDCCryptoPassphrase xxxx
OIDCRedirectURI “/redirect_uri”
OIDCResponseType “code”
OIDCStateMaxNumberOfCookies 48
OIDCScope “openid profile email”
OIDCAuthRequestParams “prompt=select_account&access_type=offline”

OIDCSessionInactivityTimeout 86400
OIDCSessionMaxDuration 31536000
OIDCRefreshAccessTokenBeforeExpiry 60
OIDCUserInfoRefreshInterval 360OIDCClientandOIDCClientSecretare the values noted in Part Three from Google.OICCryptoPassphraseis just some arbitrary string used to encrypt the signals here, it can be anything you like.OIDCScopethe setting above means anyone within your Google organisation authenticating with their email address is granted a token. Discussion of scopes is beyond this document.- Discussion of other settings can be found here https://github.com/zmartzone/mod_auth_openidc
OIDC here stands for OpenID-Connect and can be considered synonymous with OAuth.
The following is a fragment for the Grafana virtual host in Apache’s configuration:
<VirtualHost *:8080>
   ServerName grafana.example.com
   RedirectMatch ^(/?)$ https://grafana.example.com/
</VirtualHost>

<VirtualHost *:8443>
   ServerName grafana.example.com
   ProxyRequests On
   ProxyPreserveHost On
   ProxyVia On
   ...
   SSLEngine on
   ...
   <Proxy *>
       Order deny,allow
       Allow from all
   </Proxy>

   <location />
       proxypass http://grafana:3000/ connectiontimeout=3 timeout=60
       proxypassreverse http://grafana:3000/
       setenv proxy-nokeepalive 1
       setenv proxy-initial-not-pooled 1
       authtype openid-connect
       require valid-user
   </location>
</VirtualHost>
The first VirtualHost stanza redirects http requests to https.
The second VirtualHost stanza redirects https requests to http://grafana:3000 in my case the Apache proxy and Grafana are both docker containers running in the same host, Apache on ports 8080 and 8443, Grafana on port 3000. Note this is only allowed on the condition of a valid user, authenticated by OpenID-Connect or OAuth.
Part Four: Kubernetes & Nginx Ingress controller
When running in Kubernetes we require something to sit between the Nginx Ingress Controller and redirect requests to our authentication provider and act as gatekeeper for our sensitive applications.
I’ve found the oauth2-proxy image ably does the job, and it is deployed using the following resource definition:
---
apiVersion: apps/v1
kind: Deployment
metadata:
 labels:
   k8s-app: oauth2-proxy
 name: oauth2-proxy
spec:
 replicas: 1
 selector:
   matchLabels:
     k8s-app: oauth2-proxy
 template:
   metadata:
     labels:
       k8s-app: oauth2-proxy
   spec:
     containers:
     - args:
       - --provider=google
       - --email-domain=example.com
       - --upstream=file:///dev/null
       - --http-address=0.0.0.0:4180
       - --set-xauthrequest
       env:
       - name: OAUTH2_PROXY_CLIENT_ID
         valueFrom:
           secretKeyRef:
             name: monitor-oauth
             key: client-id
       - name: OAUTH2_PROXY_CLIENT_SECRET
         valueFrom:
           secretKeyRef:
             name: monitor-oauth
             key: client-secret
       - name: OAUTH2_PROXY_COOKIE_SECRET
         valueFrom:
           secretKeyRef:
             name: oauth2-proxy
             key: cookie
       image: quay.io/oauth2-proxy/oauth2-proxy:latest
       imagePullPolicy: Always
       name: oauth2-proxy
       ports:
       - containerPort: 4180
         protocol: TCP
       securityContext:
         allowPrivilegeEscalation: false

---
apiVersion: v1
kind: Service
metadata:
 labels:
   k8s-app: oauth2-proxy
 name: oauth2-proxy
spec:
 ports:
 - name: http
   port: 4180
   protocol: TCP
   targetPort: 4180
 selector:
   k8s-app: oauth2-proxy

---
apiVersion: networking.k8s.io/v1
kind: Ingress
metadata:
 name: oauth2-proxy
spec:
 ingressClassName: nginx
 rules:
 - host: grafana.example.com
   http:
     paths:
     - path: /oauth2
       pathType: Prefix
       backend:
         service:
           name: oauth2-proxy
           port:
             number: 4180
 - host: k8s-dashboard.example.com
   http:
     paths:
     - path: /oauth2
       pathType: Prefix
       backend:
         service:
           name: oauth2-proxy
           port:
             number: 4180
 tls:
 - hosts:
   - grafana.example.com
- k8s-dashboard.example.com- Again this configuration uses a Google email domain for authentication.
OAUTH2_PROXY_CLIENT_IDandOAUTH2_PROXY_CLIENT_SECRETare set to the values provided by Google in Part Three.OAUTH_PROXY_COOKIE_SECRETis an arbitrary string of your devising.- The
oauth2-proxyservice is standard. - Define an
ingressfor each of the monitoring tools, complete withtlscertification.
A typical log entry from this pod looks something like this:
192.168.13.146:56810 - d7bfe0b388ab6c9d6913d98d6e505507 - andrew.pickin@example.com [2022/12/01 11:04:37] grafana.epimorphics.net GET - "/oauth2/auth" HTTP/1.1 "Mozilla/5.0 (Windows NT 10.0; Win64; x64) AppleWebKit/537.36 (KHTML, like Gecko) Chrome/107.0.0.0 Safari/537.36" 202 0 0.000and the ingress-controller like this:
<originating ip> grafana.example.com - [01/Dec/2022:16:40:24 +0000] "GET /oauth2/auth HTTP/1.1" 202 0 "https://grafana.example.com/?orgId=1" "Mozilla/5.0 (Windows NT 10.0; Win64; x64) AppleWebKit/537.36 (KHTML, like Gecko) Chrome/107.0.0.0 Safari/537.36" 2764 0.001 [monitoring-oauth2-proxy-4180] [] 192.168.12.177:4180 0 0.001 202 c5dd16db823b5d328fc21923158c49b4 1669912824.267Part Five: conclusion
The above provides:
- A way of securing any application running in your production environment, whether the application has inbuilt security or not, running in virtual hosts or Kubernetes.
- A consistent user experience in securing each application.
I believe using a proxy with OAuth is more secure than attempting to configure each monitoring application’s OAuth capability individually as each application is directly externally visible. Mistakes in configuration will therefore compromise your system.
Andrew also posts on his Medium account – the original version of this post can be found there.