Redan joined the team this summer for a remote internship, to build tools that would enable us to crunch unstructured data a lot more efficiently.
We work with organisations and government bodies to help make sense of their data in order to make it useful, by publishing it in a more usable format. Often this is an application, or a website that will pull through the information that the user wants. Through the summer we’ve worked on multiple projects for clients including the Food Standards Agency, the Environment Agency and others where we needed to quickly process legacy data to get a sense of shape and structure quickly.
At the start of a project there is a lot of data to prepare and analyse to prepare data models and make architectural choices. To be able to make sense of the data, this process starts with one of our Linked data specialists analysing the existing data (often .csv or MS Excel files) to find associations between information and define categories that enable us to come up with a structure that makes sense behind the scenes. All the existing data can then be put into this new structure before being published. Any new data going forward can then be added to the same structure. This structured data then feeds into the digital service or application.
Done manually – or even writing scripts manually – for each file, separately for each new project is time consuming (often when time is critical), and relies too much on the team spotting patterns.
Under Stuart’s mentorship, Redan was tasked with building a number of tools that could reduce the manual element of this analysis. Ultimately, this would mean we could spend time looking at the useful data rather than categorising it. We often have multiple large and sometimes messy spreadsheets to try and extract useful information from and restructure in a way that makes it usable.
His first challenge was to look at how to identify key columns in data sets, by highlighting unique data in each row.
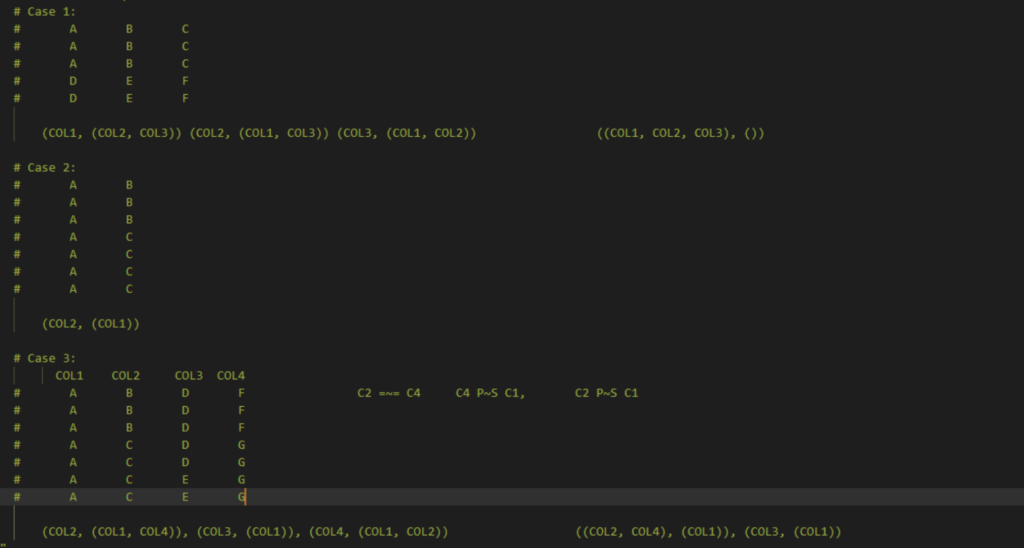
That then progressed into a couple of more complex challenges, involving looking at several columns at once, rather than just comparing two. He began by finding control terms – that is, columns that share the same set of values.
The last assignment was to find denormalised concepts of code occurrences, and analyse the relationships between the columns, rather than each column individually. Denormalisation, put simply, means that the same piece of information is encoded in multiple places. Instead of looking at all possible combinations of columns, which is very slow, we can look at all 2-combinations, and check they have the relationship we’re looking for. Each of these combinations are then represented as part of a graph, where an edge represents the existence of the relationship between the two nodes, and we can then check the components of the graph.
Redan built these tools in Python using the Pandas Library – a flexible, open source data analysis and manipulation tool, built on top of the Python programming language. He tested the code using Unittest – a python testing framework, as well as participating in code reviews with Charlie, another of our summer interns.
Ultimately, the intention of the project as a whole was to work towards using machine learning to spot these patterns within complex data sets without requiring as much user input.
Redan found the internship a useful step after his degree, before heading onto his Masters at Bath University – benefiting from the development talks in our weekly sessions, in particular one run by Simon on building tests into your code.
#TechTalk