Client: The Environment Agency
Our Role: End to end solution – modelling, data pipeline, real time API, embeddable widgets
Site: https://environment.data.gov.uk/flood-monitoring/doc/reference
The Environment Agency provides a range of real time information related to flooding and flood risk. These include:
– Flood alerts which provide warnings or alerts if there is an ongoing flood or a risk of imminent flooding in a specific area around a water body or near to a section of coast.
– Measurements of current river levels and flow rates taken from more than 3,000 measurement stations across the country.
– Flood forecasts which indicate the risk of flooding at county level for the next few days.
The Agency wished to make this information available as Open Data through an API (Application Programming Interface) that would enable developers to access the data in real time, as well as through daily dumps for offline analysis.
Building on our expertise in linked data modelling and API design we developed a design which is accessible to typical web developers while benefiting from use of linked data approaches.
THE CHALLENGE
Provide flood alert and monitoring data through a set of clean, easy to use set of data APIs for third party web developers to build upon, deliver the data in real time through a resilient infrastructure.
OUR APPROACH: THE CHALLENGE OF METADATA
The challenge with data like this, and defining interfaces to access it, is not so much the data as the metadata.
Take the measurement of river levels and flows as an example.
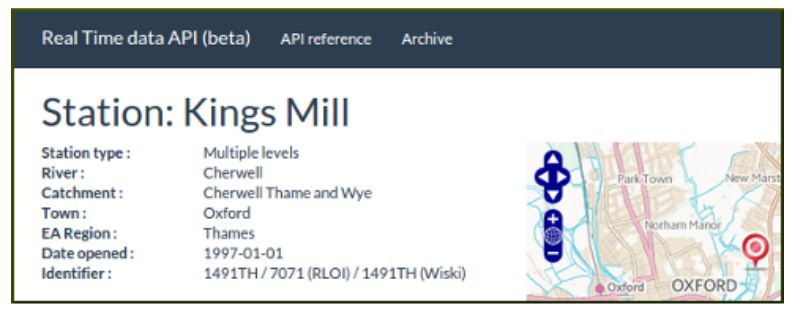
Knowing that a measurement taken at 12:00 today was 0.77 isn’t very useful unless you know exactly what was measured (height, in metres, relative to a measurement stage, instantaneous not averaged, updated every 15 minutes) and where (Kings Mill monitoring station 1491TH). Even then to be of use we need to know more about this station – where it is geographically, what river it’s on (Cherwell) and what river catchment that’s part of (Cherwell Thame and Wye). It also really helps to have a notion of scale – what’s the usual range of the river at that location (0.73 to 1.65), what’s the maximum and minimum range on record (0.31 to 2.61)?
In fact it takes seven parameters just to uniquely identify a particular measurement series, even then you need some way of look up the magic identifiers such as 1491TH and find out the location, river and range information.
Linked data principles are huge help tackling issues like this. We assign a web identifier (URI) to every measurement station and to every individual measurement series (some stations can provide multiple measurements such as river level above and below a weir plus a flow rate). We can take the metadata from several different sources provided by the Environment Agency and integrate them into a single description of the stations and measurements.
So a table of readings only needs to refer to one identifier (the measurement URI) instead of seven parameters. Yet that identifier acts as as way to locate all the metadata – giving you both a human readable web page describing it and machine access to the metadata to enable meaningful analysis and presentation of the data. The data becomes self-describing – no more getting stuck wondering how you find out what 1491TH means.
OUR APPROACH: API DESIGN
Once we have the (meta)data sorted out then we need an API to access it.
We follow standard practices for design of web APIs, particularly the so called RESTful style which builds upon the principles that make the web itself so scalable. However, we also want the API to integrate naturally with our identifiers for measurements and stations.
So if our identifier for Kings Mill is:
then it makes sense to have the address for getting all readings from that station be:
In this way we can follow the patterns that web developers expect for accessing data while integrating in identifiers for the key elements in the data. This tasteful blending of linked data principles and web API principles leads to a clean API that developers can work with easily while gain the benefits of linked data to connect the raw data to all the different elements of metadata that put the data into context.
On top of this core design we then provide the API elements to allow users to slice and dice the data how they need.
- Unambiguous identifiers for measurements and measurement points.
- Self-describing – just go to the URI to see what it means
- Integrated – different sources of metadata brought together in one place to give context to the data
Widgets
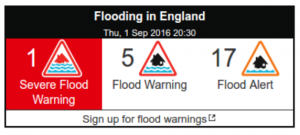
More recently the Environment Agency asked to extend the service to provide a set of flood alert widgets. These enable local authorities and other groups to easily embed a summary of the number of current flood warnings and alerts for their area (county) or for the whole country.
We were able to achieve this through a near-serverless design that uses the scalable storage and content distribution network facilities of our underlying cloud provider (Amazon Web Servers) to provide fully resilient access to widgets without having the manage and run dedicated servers for this task. The widgets are updated every 15 minutes as part of the data processing jobs running on our Data Share Platform.
Delivering the service
The service was implemented on top of our Data Sharing Platform.
The platform takes data from five different sources on different timescales (some updates every 15mins) and integrates them into master linked data store hold the last 28 days worth of data.
The API implementation takes the web requests from data users, extracts the requested data from the store and streams the results out in a variety of formats. By supporting web developer formats (JSON), and spreadsheet-friendly format (CSV) as well as linked data (RDF) formats we can satisfying a broad range of different usages from a single common (linked data) source.
The store is replicated and managed by our platform so that it can be scaled to meet different levels of demand and individual servers can be switched out for maintenance without affecting the service.
The data management service itself is also replicated in master/slave mode so that the data preparation pipeline is also resilient.
The service has been delivering the data reliably (more than 99.997% availability) since spring 2015, handling between 100k and 400k requests a day
Project summary
- Provided a clean design for access to the data which integrates linked data identifiers with developer-friendly API design.
- Use of linked data principles makes the data self-describing and allows us to integrate more context information in the future.
- The API is delivered in real time through our resilient and scalable Data Sharing Platform.
- Provides a foundation for end users tools such as flood alert widgets.