
The Environment Agency’s hydrology archive is a tremendous asset with records from tens of thousands of measurement stations across England – river levels, river flows, groundwater levels, rainfall – spanning decades of measurements, many at 15 minute resolution. It has been very satisfying to make much of this data openly available through the Hydrology service, which also includes historic and current real time water quality measurements, thanks to data from Meteor Communications.
As well as supporting interactive exploration of the data and manual download of time series, the hydrology service provides for automatic download of data through a rich web (REST) API.
In previous #TechTalk articles Tom has described the service and in Accessing the Environment Agency’s continuous monitoring archive via API, he gives a great introductory tour of the API.
Going beyond this we find that some users want to maintain their own local copy of some of the data, keeping it up to date in real time. How best to do that through the API without falling foul of fair use restrictions?
Tracking small numbers of stations
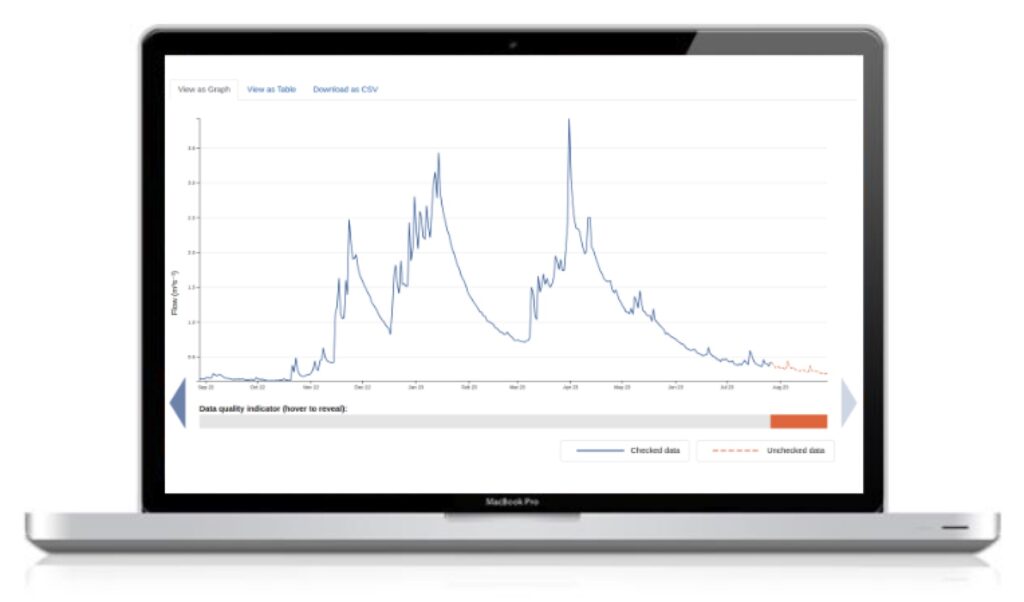
First, let’s take the simplest case where you just want to track the data from one station. Let’s pick Bourton-on-the-Water Dikler again, as used in the earlier article. Tom showed how to find the ID of that station and list what observed properties, and measurements of them, are on offer. So jumping off from there let’s try to track the sub-daily flow measurements for that station.
To begin with we want to seed our local copy by fetching the historic data. For example if we want to track just recent years we might fetch:
https://environment.data.gov.uk/hydrology/id/measures/fdfac74b-f168-40d6-9f97-2efc9ac6a964-flow-i-900-m3s-qualified/readings.csv?min-date=2022-01-01&_limit=100000This will return a 10 MB CSV file with 57,000 rows in a few seconds. If you want the entire history for that time series, which dates back to 1995 you could drop the min-date filter. That’s much more data so you would need to increase the limit setting to 1200000. The API defaults to a soft limit of 100k rows and imposes a hard limit of 2 million rows, which should be enough to download even the longest time series. In this case that entire time series is just under 1 million rows, 170 MB of download.
Good start but how can you keep your local copy up to date?
You might think, since the data has a time resolution of 15 mins, that you could simply fetch the latest reading for that site every 15 mins. The latest reading API is very efficient and a good way to find out the current value.
https://environment.data.gov.uk/hydrology/id/measures/fdfac74b-f168-40d6-9f97-2efc9ac6a964-flow-i-900-m3s-qualified/readings.csv?latestHowever, if you only use this you’ll end up with gaps in your data record. Why is this?
There’s a lot of factors at play but at a high level there’s many processing and storage steps between a reading being taken and it arriving in the hydrology service.
For example, at the measurement station itself readings will be held in a data logger which may only transmit its data periodically (e.g. daily if the data isn’t time sensitive). Then only some of that raw telemetry is accessible to the hydrology service, other data only arrives with us after it has been loaded into EA’s master water data archive (“Wiski”) and then exported again. All of which means that as well as there being delays before publication then new data tends to appear in batches with several readings being updated in one go.
So if you only check the latest value then when a batch arrives you’ll only see the last value in that batch not the earlier values, leaving gaps in your local record.
To avoid this, instead you can ask for all data since the time of the most recent value you’ve seen. For example, if the last row of our earlier CSV file was a reading with dateTime 2023-08-15T09:30:00 then we could poll for all new data since then using:
https://environment.data.gov.uk/hydrology/id/measures/fdfac74b-f168-40d6-9f97-2efc9ac6a964-flow-i-900-m3s-qualified/readings.csv?min-dateTime=2023-08-15T09:30:00If there is no new data available yet then that will return an empty result. If there is new data then it will return all rows after that date time up to the most recent available. You can append the results to your local copy and then update the min-dateTime threshold for the next call.
Note that, for similar reasons to the discussion on latest, you need to use the actual date time from the most recent reading you’ve found, not the date time at which you last checked for data.
Frequency of checking
Since most data is updated at most daily then a daily check of the station will be sufficient for most use cases. Even when a site has raw telemetry available the telemetry is often only uploaded a few times a day.
Only in exceptional cases where you are certain the data is being updated in near real time would it make sense to recheck every 15 mins.
Tracking multiple stations
If you want to track data from multiple stations up to a few hundred then you can simply use the above datetime tracking approach and make a series of separate calls. If, during your daily update run, you check one station each second (a reasonable request rate) then you could scan, for example, all sub-daily flow time series stations in 10-15 mins. Doing this once a day would be an acceptable use of the service.
But what if you want to try tracking all the data?
This is hard to do and should be an exceptional case. It’s much better to rely on the service to do the data tracking and then query for what you need on demand rather than try to replicate the entire data feed.
However, there is one way you can approximate this. As well as downloading data for individual time series there is also a generic readings endpoint that allows you to download data for multiple time series at the same time or even for all time series. The limitation here is that the sheer size of the data means that we have to limit the use of this. In particular, just like any other query it is limited to returning a maximum of 2 million rows at a time. However, that is enough for several days of data.
Which means that you can track the regularly updated data using a single daily call to:
https://environment.data.gov.uk/hydrology/data/readings.csv?min-date=X&_limit=1000000where you set X to correspond to e.g. two days ago.
This will leave some gaps where stations aren’t updated daily or near daily but it is a much more efficient way to track the frequently updating data than thousands of separate calls. For the less frequently updated stations you can fall back on the per-time series approach as above.
Rewriting history
So you have a local copy of some set of time series, and it’s being reliably updated as new data is available. Are we done?
Not quite. When new data arrives in the service it is typically marked in the quality flags as unchecked. Over time the EA team reviews and checks the data from the stations and will update these quality flags and, less frequently, might apply corrections to data values.
The data in the service is revised periodically to reflect this quality control. There is a rolling program of rewriting the last year of data for all the stations on a monthly basis.
This means that in addition to a daily fetch of new data you would need to implement a similar monthly program of refreshes for recent history. There’s no difference here to the above API examples other than the sheer volume of the data involved and thus the need to spread the queries out over time so as not to risk getting banned for unreasonable use of the service.
Good practice and fair use
Currently the formally enforced limits of use for the service are very generous. It allows up to 2 million result rows per query and allows bursts of up to 10 requests per second from a single IP address. The permitted sustained request rate is under review but likely to remain at or above 1 request per second.
However, this is a publicly funded service and excessive use would both impact other users and the cost of running the service. So users who abuse the service may be subject to banning or tighter request rate limits.
To avoid this fate there are some good practices to be aware of:
- Be sensible about how frequently you query the data. There’s no point in querying everything every 15 mins, limit that to special cases where you know there’s near real time updates and you really need the data as soon as possible.
- Don’t redundantly download the same data over and over again. We have seen users request the last month of data for thousands of stations, every 15 mins. Meaning that the vast majority of those calls will redownload the same month of data over and over again, burning bandwidth costs. This sort of behaviour will lead to banning.
If you recognize yourself in that description please get in touch!
- Put contact details in the user agent string for your requests. That way if your usage is problematic then you can be contacted to work out a better way to achieve your ends without risking an outright ban.
The future
The service continues to grow with new data feeds being planned, possibly including an expansion in the range of telemetry data available.
As we gain more feedback on how people want to use the service then we will be on the lookout for ways we can improve the API to make it easier for people to get what they need.
For example, given the very complex mix of how data is updated and rewritten over time then keeping an up to date local copy of some slice if data is not easy. Hopefully these notes have helped but we could also imagine other support such as a “changes only” API which would allow you to see all changes to the data – whether new data or updates to old data – in one easy to use place.
If you have requirements like that or any questions about how best to use the data then please contact HydrometricOpenData@environment-agency.gov.uk.