We have developed a major revision to the service launched in 2023. This expands the range of measurements (including rainfall, river levels and water quality), expands the number of sampling sites and increases the resolution of most measurement series to 15 minute sampling frequency. In total this represents a thousand-fold increase in data volume with over four billion rows of readings now accessible through the service. This scaling is made possible through our Agora Measurement Store technology.
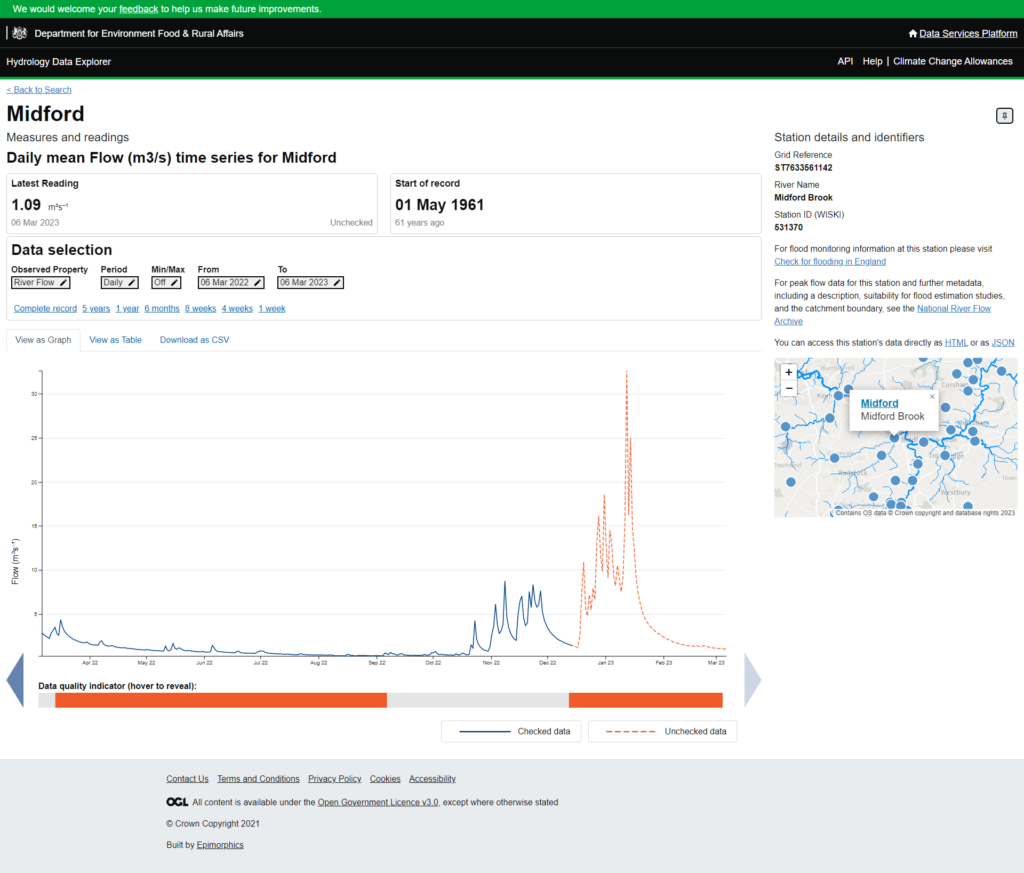
The move to high resolution time series also enables a cleaner integration of near-real time telemetry and historic time series. New 15 min telemetry data is appended to each time series as it is received. Then, as quality checked data becomes available, the time series is updated to show any corrected data and the quality control state. In this way the most up to date data is always available and users can see from the quality control flags which data has been checked and which is raw unchecked telemetry.
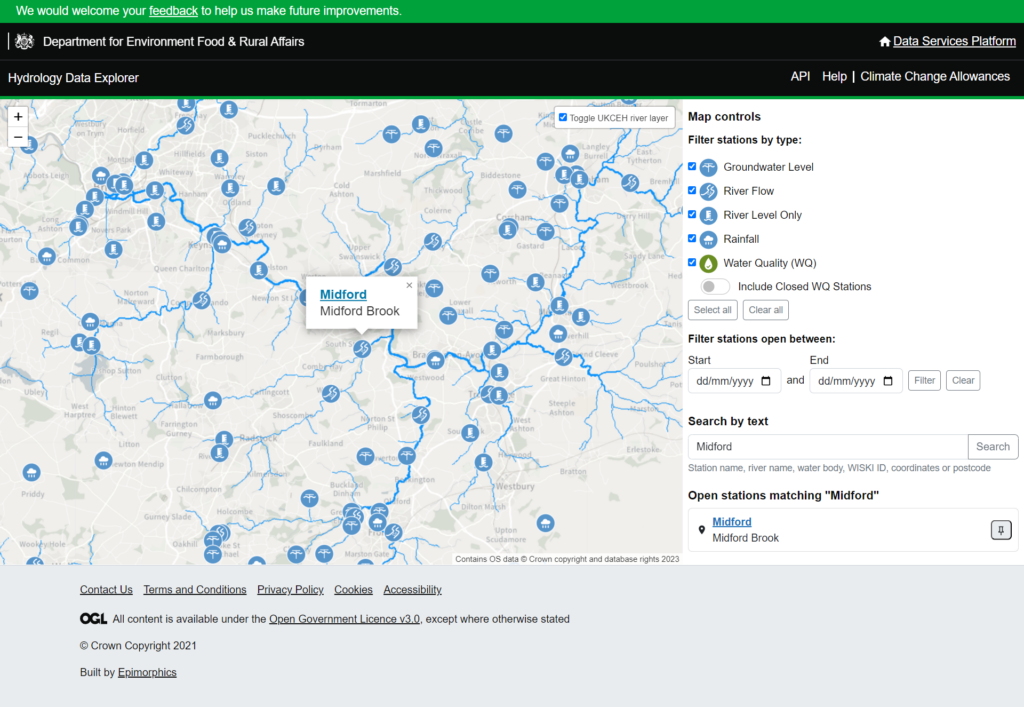
For more information about the current data, application, API usage, and for a glossary of terms, please see the Hydrology Data Explorer help page.