Summary – so was it worth it?
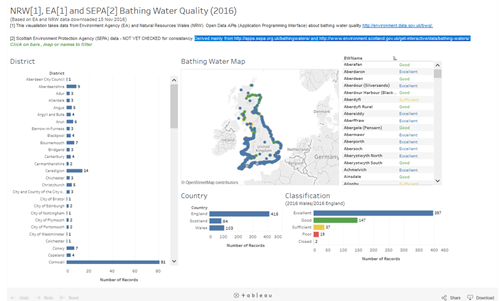
As a series of posts I explore the use of Tableau with linked-data using the Environment Agency’s (EA’s) Bathing Water Quality data API as an example. I explore a few enhancements in the visualisation such as making the presentation and interaction richer, linking out to EA’s website and pulling in data Bathing Water Quality data from Wales and Scotland.
Part 1 | Part 2 | Part 3 | Part 4
So was it worth it?
Yes very, but …
Tableau Public was/is great for:
- pulling data in open data
- quickly getting to understand a dataset
- creating rich and useful visualisations
- quickly doing initial interactive analysis over simple or complex data
- creating interactive dashboards so that you and others can explore the data
- making visualisations and dashboards publicly accessible
I could also fairly quickly add the Welsh (Natural Resources Wales) and Scottish (SEPA) bathing water quality data to create some more comprehensive dashboards. See Adding in Welsh and Scottish Data in Part 2 (Northern Ireland yet to do).
However, one of my original motivations for wanting to use the Web Data Connector mechanism was that I had thought/assumed that because it was able to pull data from a live API that I would be able to configure the publicly available/hosted dashboard so that it updated live every time a user opened the dashboard.
It seems that’s not possible – the data connector mechanism is powerful and flexible way to get data from API’s that return it in json fomat. But once it is imported, the data in the public/hosted visualisation is static – i.e. it can’t be configured to update every time a user visits the dashboard page.
It does kind of make sense – data sources can be very large, 3rd party APIs may not be reliable, etc. However it was a disappointment, having visualisation update live from APIs, (e.g. EA’s daily pollution risk forecasts during the bathing water season) would have been valuable.
If you are the author/owner of the dashboard, you can run the import anytime you want to in the desktop application – you could then republish it. So as a personal internal tool that’s fine and data that infrequently changes could be updated manually.
… So, No Need For the Web Data Connector?
The Bathing Water Quality data API (and most other Epimorphics APIs) can provide the data in a variety of standard formats, including json and CSV (Comma-Separated Values).
CSV is a standard open spreadsheet format. All spreadsheet programs like Microsoft Excel will open and ‘save as’ CSV files. CSVs can is also used directly by Tableau Public (and most other data analysis tools).
Given the data is static once imported into Tableau Public hosted visualisations, in principle it makes no difference what format the data is imported in. And in this particular case it would have been as effective, and much easier, to get the data from the API in CSV format – see Part 2.
That said there are reasons why working with json can be easier than CSVs produced by API’s based on rich/complex data, for example:
- The web data connector mechanism allows (requires) explicit selection of exactly what data (columns) is extracted from the json that the API returns. This means more control is available and data imported into Tableau Public is only and exactly what’s required
- CSVs have limitations – for example in json and linked data formats, it’s easy to deal with multiple values of a property (column) with a CSV that causes issues either that property needs multiple columns or there needs to be multiple rows per item (in this case per bathing water).
Given once you’ve written one Web Data Connector, they are quite easy to edit and reuse and they give you more control over how the data is imported, it may be that even where CSVs are available they may have advantages.
If you are interested in the Web Data Connector route – see Creating a Web Data Connector Part 3.
For people not wanting the flexiblity of using the API: the same Environment Agency data can also be obtained via EA’s bathing water qualilty exlorer website as pre-formatted CSVs.
It’s less flexible and it would need the combination data from two CSVs (Bathing water site details and History of annual bathing water classifications) to get the visualisation in this article. Tableau Public makes doing that kind of join fairly simple. However, that’s possibly for a different article!
For more in this #TechTalk series see: Part 1 | Part 2 | Part 3 | Part 4