Tableau Web Data Connectors
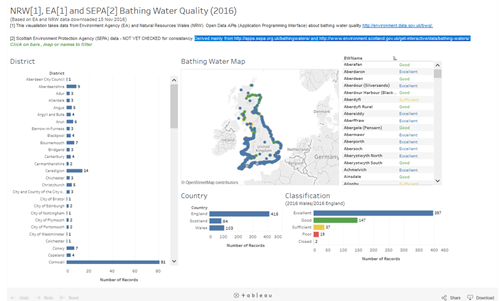
As a series of posts I explore the use of Tableau with linked-data using the Environment Agency’s (EA’s) Bathing Water Quality data API as an example. I explore a few enhancements in the visualisation such as making the presentation and interaction richer, linking out to EA’s website and pulling in data Bathing Water Quality data from Wales and Scotland.
Part 1 | Part 2 | Part 3 | Part 4
Creating a Web Data Connector
In this post I outline the process of creating and using a Tableau Data Connector (WDC) to obtain data from the Environment Agency Bathing Water Quality API (Application Programming Interface).
In essence the Web Data Connector mechanism is simple. It provides the machinery needed to connect to a web API get data in json format – see Part 2. json is probably the most common format returned by web APIs)
If you haven’t done much or any software development or worked with json data before then a couple of the steps may have a bit of a learning curve.
1. Set up the Tableau Public and the Web Data Connector Software Development Kit
As I said in the original article, as a non-developer I found the Web Data Connector (WDC) documentation a bit complex, that put me off trying the first few times I took a look. However, once I got it setup I realised I could just take one of their Web Data Connector examples, see what it was doing, and adapt it.
Note: the Tableau WDC documentation while guilding users though a process step by step, added steps that aren’t strictly necessary, e.g. the get started page says you need Git (version control system) and Node/npm (as web server and package manager) installed on your computer. While actually you can just download a zip file of the code from the Tableau github repository, unzip that in an directory on your computer and run it via any local web server. I use Windows and have the Python (programming language) installed, so I used python’s inbuilt SimpleHTTPServer.
To create your own web-connectors it’s probably easiest to use the Tableau Web Data Connector SDK (Software Development Kit) – that provides a simulator that means you can test out data connectors as you are developing them and also (very helpfully) pre-written example web data connectors.
However, once again if you are in a corporate IT environment, you’ll possibly need to discuss with your IT team. As well as installing Tableau Public (see above), the Tableau getting started instructions for using Web Data Connector SDK, also requires the installation of other software (i.e. local web-server ‘node and npm’ and a version control system ‘git’). These aren’t strictly necessary (see note above), but at a minimum you will need to be able to run a local web-server, i.e. a program that can serve web-pages from your own computer.
Once you have created a Web Data Connector it can be hosted on any web-server accessible from the computer you are using the Tableau Public application on (e.g. an intranet server)
2. Get the Data
EA’s Bathing Water Quality API provides a rich mechanism for querying EA’s bathing water Quality data that lies behind it’s Bathing Water Quality Explorer. The data for my initial experiment was based on simple single API request:
https://environment.data.gov.uk/doc/bathing-water.json?_view=bathing-water&_pageSize=1000&_page=0
This returns key data about designated bathing waters in England, e.g. Bathing Water ID. Name, Lat/Long, Compliance Classification, Local Authority area and Water Company area.
It is in json format. You can view the data more easily by switching the format to HTML replacing .json with .html in the URL:
https://environment.data.gov.uk/doc/bathing-water.html?_view=bathing-water&_pageSize=1000&_page=0
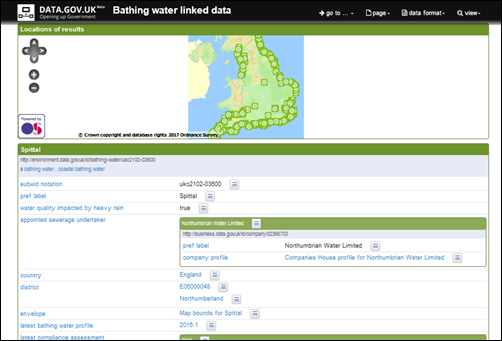
I find that helpful in seeing what data is there and roughly how it’s structured. There is also the API documentation for specific details.
3. Writing a Tableau Public Web Connector
Once it’s created a Web Data Connector will consist of two files, an HTML and a Javascript file. These are all that’s needed and they can be hosted on any server accessible from the machine where you are using the Tableau Public application.
Once I had the SDK up and running, that is, I had one of the demo Web Data Connectors working, I could see how they worked.
The SDK data directory structure is shown below.
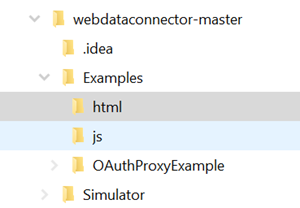
The example HTML files are in the html directory and javascript files in the js directory. I used the earthquakeUSGS.html example as that’s the one the Tableau Web Data Connector tutorial used.
That tutorial takes you though the the structure and workings of the HTML file and javascript file for that example.
The HTML file is short, it simply gives a way of triggering the data import.
Editing the example HTML file only needs a few changes, the title, link to the javascript file and the button label.
EABathingWatersBasic.html
<html>
<head>
 <title>EA Bathing Water Quality Feed</title>
 <meta http-equiv="Cache-Control" content="no-store" />

 <link href="https://maxcdn.bootstrapcdn.com/bootstrap/3.3.6/css/bootstrap.min.css" rel="stylesheet" integrity="sha384-1q8mTJOASx8j1Au+a5WDVnPi2lkFfwwEAa8hDDdjZlpLegxhjVME1fgjWPGmkzs7" crossorigin="anonymous">
 <script src="https://ajax.googleapis.com/ajax/libs/jquery/1.11.1/jquery.min.js" type="text/javascript"></script>
 <script src="https://maxcdn.bootstrapcdn.com/bootstrap/3.3.6/js/bootstrap.min.js" integrity="sha384-0mSbJDEHialfmuBBQP6A4Qrprq5OVfW37PRR3j5ELqxss1yVqOtnepnHVP9aJ7xS" crossorigin="anonymous"></script>

 <script src="https://connectors.tableau.com/libs/tableauwdc-2.0.latest.js" type="text/javascript"></script>
 <script src="../js/EABathingWatersBasic.js" type="text/javascript"></script>
</head>

<body>
 <div class="container container-table">
 <div class="row vertical-center-row">
 <div class="text-center col-md-4 col-md-offset-4">
 <button type = "button" id = "submitButton" class = "btn btn-success" style = "margin: 10px;">Get Bathing Water Data!</button>
 </div>
 </div>
 </div>
</body>
</html>
The javascript file/code does the work of:
- specifying the API call to be made at the top of the
// Download the datasection - what data elements are wanted from the returned data in the and the
// Define the schemasection. Those will be columns in the Tableau source - specifying how to extract those pieces of data from the returned json data (object) in the
// Iterate over the JSON objectsection. The Javascript file (seeEABathingWatersBasic.jscode below), is a bit more complicated to edit, but after following the Tableau Web Data Connector tutorial and looking back at the example json for a bathing water above, it will hopefully be clear how the data to be extracted is specified in the// Define the schemasection and extracted in the // Iterate over the JSON objectsection
The if statement in the //iterate over JSON object section deals with the rare cases where there is no latestComplianceAssessment property for a bathing water – that will be the case if it was newly designated as a bathing water in the last year.
These two files can sit in the same directories as the Tableau examples. The Tableau Simulator will let you test the connector. It should work just like the earthquakeUSGS example that came with the SDK.
EABathingWatersBasic.js
(function() {

// Create the connector object var myConnector = tableau.makeConnector();
// Define the schema
myConnector.getSchema = function(schemaCallback) {
    var cols = [
        {id: "bwEUBWID", dataType: tableau.dataTypeEnum.string},
        {id: "bwName", alias: "Name", dataType: tableau.dataTypeEnum.string},
        {id: "bwDistrict", alias: "District", dataType: tableau.dataTypeEnum.string},
        {id: "bwCountry", alias: "Country", dataType: tableau.dataTypeEnum.string},
        {id : "lat", alias : "latitude", dataType : tableau.dataTypeEnum.float },
        {id : "lon", alias : "longitude", dataType : tableau.dataTypeEnum.float },
        {id: "appointedSewerageUndertaker", alias: "WaterCompany", dataType: tableau.dataTypeEnum.string},
        {id: "bwrBWDAssessment", alias: "Classification", dataType: tableau.dataTypeEnum.string}
    ];

    var tableSchema = {
        id: "bathingWaterQualityFeed",
        alias: "Bathing Water Quality Data for EA Bathing Waters",
        columns: cols
    };

    schemaCallback([tableSchema]);
};

// Download the data
myConnector.getData = function(table, doneCallback) {
    $.getJSON("https://environment.data.gov.uk/doc/bathing-water.json?_view=bathing-water&_pageSize=1000&_page=0", function(resp) {
        var feat = resp.result.items,
            tableData = [];

        console.log(feat);

        // Iterate over the JSON object
        for (var i = 0, len = feat.length; i < len; i++) {
            var obj = feat[i];
            var newObject = {
                "bwEUBWID": obj.eubwidNotation,
                "bwName": obj.name._value,
                "bwDistrict": obj.district[0].name._value,
                "bwCountry": obj.country.name._value,
                "appointedSewerageUndertaker": obj.appointedSewerageUndertaker.name._value,
                "lat": obj.samplingPoint.lat,
                "lon": obj.samplingPoint.long
            };

            if(obj.hasOwnProperty("latestComplianceAssessment")) {
                newObject["bwrBWDAssessment"] = obj.latestComplianceAssessment.complianceClassification.name._value;
            } else  {
                newObject["bwrBWDAssessment"] = "Newly Designated";
            }
            tableData.push(newObject);
        }

        table.appendRows(tableData);
        doneCallback();
    });
};

tableau.registerConnector(myConnector);

// Create event listeners for when the user submits the form
$(document).ready(function() {
    $("#submitButton").click(function() {
        tableau.connectionName = "EA Bathing Water Quality Feed"; // This is the data source name in Tableau
        tableau.submit(); // This sends the connector object to Tableau
    });
});

})();
4. Using the Web Data Connector
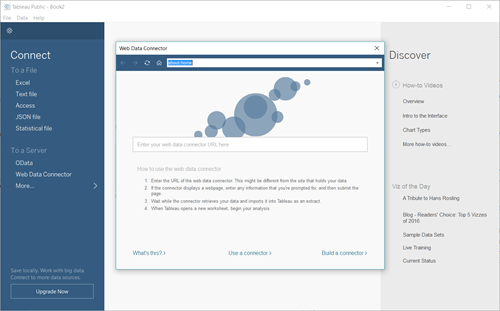
Once the connector is working in the simulator, you can use the connector as a connection in the Tableau Public application.
In Tableau Public opening screen, choose Web Data Connector as the source. Paste the URL of the Web Data Connector – as used in the simulator into the form field.
If that’s working the data will be imported and displayed in the table as shown below.
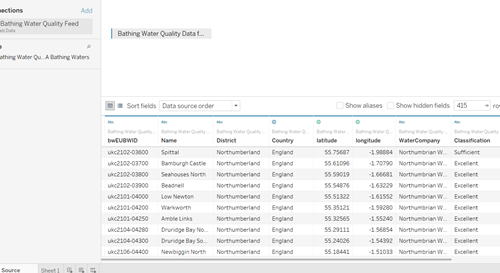
Once the data is in the Tableau Public application, the worksheets/charts and dashboard is then just the same as using the CSV file as above, except that the data is already in a simplified and easier to use form.
For more in this #TechTalk series see: Part 1 | Part 2 | Part 3 | Part 4